
Towards drone-borne gammaray mapping of soils
ST Limburg.pdf
Han Limburg1*, Steven van der Veeke1 and Ronald Koomans1 discuss the latest thinking on spectral gamma-ray technology for use in drone-borne surveying.
1. Introduction
There is a strong growth of interest in UAV’s (Unmanned Aerial Vehicles, aka drones) as a sensor platform in geophysical surveying. Not so much to replace traditional piloted airborne surveying platforms (Figure 1). The usefulness of drones as a platform seems much more to replace walking or driving surveys. Drones are very handy tools to survey areas that cannot easily be accessed by foot or by vehicle, and that are too small to be mapped economically with traditional airborne systems.
The last couple of years has shown a boom in the application of drones in geosurveying. More and more of the instrumentation used traditionally in geosurveys is becoming adapted to be used under a drone – think of magnetometers, EM systems, small GPR antennas but also geotechnical tools like LIDAR are being adapted to lightweight versions for drone use.
In this article, we present another technology that in high demand for drone-borne surveying: spectral gamma-ray (Van Der Veeke et al., 2018). Mapping (natural) radioactivity for many years has been one of the standard items in the survey toolbox of a geophysicist. All rocks, soils and sediments contain tiny amounts of radioactive isotopes of potassium (40K), uranium (238U) and thorium (232Th). Their concentrations can be measured with a high degree of accuracy by spectral gamma tools and provide quantitative information on the type of soil or sediment under study.
{}
2. Radiation mapping as a geophysical tool–the Dutch approach
The use of spectral gamma-ray sensors as a tool to map soil and sediment properties, has a long-standing tradition in the Netherlands. In the early Nineties, Prof. Dr. Rob de Meijer founded a research group at the nuclear accelerator facility (KVI-CARS) at the University of Groningen. His group did a lot of pioneering work studying the use of radiation sensing in the geological and geophysical domains. For instance, they developed1,2 MEDUSA (‘Multi-Element Detector System for Underwater Sediment Activity) – a gamma-ray system initially designed to map seafloor sediments for heavy minerals. And by the end of the Nineties the group was one of the first to have a go at ‘lightweight airborne surveying’. In a collaboration with the South African Council for Geoscience (CGS) they mapped a mine tailing near Potchefstroom using an ultralight plane with two small detectors mounted on the wings.
Since these early days a lot of R&D work has been done by the group and its (commercial) spin-offs. Both to optimize gamma-ray hardware and software for geophysical use and to develop ‘application models’ that relate radionuclide concentrations to soil and sediment properties.
In the following sections we will highlight these developmentsand show how they merge together in modern drone-capable instrumentation.
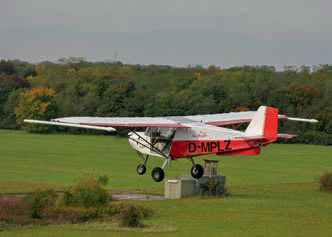
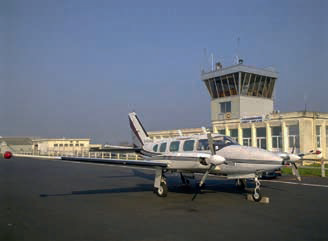
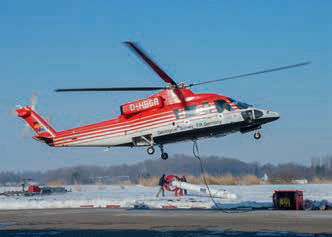
Figure 1 Traditional survey platforms – Piper PA-31 (Terraquest), Sikorsky S-76B (BGR) and Skyranger 912 (Terratec).
1 Medusa Radiometrics BV
* Corresponding author, E-mail: han@medusa-online.com
2 The MEDUSA system was developed in a collaboration with the British Geological
Survey.
3. Spectral gamma-ray instruments
Spectral gamma-ray tools are devices that are used to measure the energy distribution of gamma radiation. Gamma rays are a highly energetic type of electromagnetic radiation emitted by the aforementioned natural sources, but also by man-made sources like 137Cs (cesium), 60Co (cobalt) and others. One could say that there are two dominant technologies for recording gamma radiation:
semiconductor-based systems and scintillator crystal-based sensors.
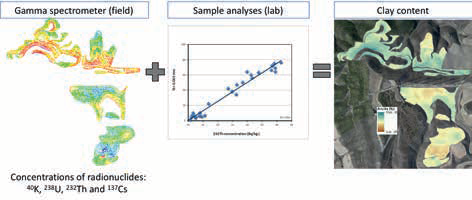
Figure 2 The gamma-ray survey data can be translated into a clay map, using 232Th as a predictor. The model was based on relating the 232Th content in samples taken in the area to the clay content.
It is important to note that – in contrast to many other geophysical systems – gamma-ray sensors are passive. They do not emit radiation; they only respond to radiation entering their volume.
4. Semi-conductors
Semi-conductor systems can be considered ‘high-end’ as they provide very high energy resolution allowing separation of complex cocktails of radiating substances for instance found in nuclear medicine or nuclear power plants. These systems, of which the high-purity Germanium (hpGe) system is the most used, are typically used in the lab as they need to be cooled to liquid nitrogen temperature which makes them heavy and energy consuming.
5. Scintillator-based sensors
Scintillator-based systems are much simpler by design. Scintillators are crystals that convert gamma radiation into a light flash with an intensity proportional to the energy absorbed from the incoming gamma photon. The light can be recorded by an optical device like a photomultiplier tube (PMT) or by (modern) silicon photomultipliers and then transferred into a radiation- or energy spectrum.
Although examples are known of semi-conductor systems used as handheld or airborne systems in geophysics, by far the most commonly used technology for mapping radioactivity is
the scintillator. Scintillator systems can in principle be made in any size and shape. Moreover, several crystal types are available with specific properties allowing targeted system design. Table 1 some of the commonly available crystals and some of their properties.
Despite the broad choice in design options3, many systems used in geophysics are still based on NaI crystals of 4x4x16 inch (in airborne and vehicular systems) or 2x2 and 3x3 inch size (handhelds). However, in the last decade several people started to use other crystal types and sizes much more tailored to their application. Most notably in borehole geophysics, where for instance BGO is used in slimline tools, but also in airborne and vehicle-borne systems where the use of CsI crystals as a much more robust and stable alternative for NaI has become common practice.
Detector Material | Density (kg/l) | Typ. resolution* | Hygroscopic | Brittle | Price |
|---|---|---|---|---|---|
(Plastic) | <1 | None | No | No | --- |
Nal | 3.7 | 6.5% | Yes | Yes | - |
Csl | 4.5 | 7.5% | No | No | -+ |
CeBr3 | 5.2 | 3.9%-4.2% | Yes | Yes | ++ |
LaBr | 5.3 | 2.8%-4.0% | Yes | Yes | ++ |
BGO | 7.1 | 10% | No | No | + |
(High purity Germanium) | 5.4 | 0.2%-1% | Yes | -- | +++ |
Table 1 Some commonly used scintillator crystals and their properties. The resolution listed is the peak resolution measured at 667keV (the 137Cs peak). Plastic and hpGe are listed as references only.
6. Application models
It has been known for many decades that the amounts of 40K, 232Th and 238U in soils and sediments are a measure of their mineral properties. This phenomenon is used for instance in oil and gas and mineral prospecting to get a qualitative image of the mineral composition of an area or rock matrix. The research that started in De Meijer’s group, however, has helped to quantify this phenomenon. It was found that several soil and sediment properties can be predicted with a high degree of accuracy by their radionuclide content. In other words, radionuclide concentrations
form a ‘radiometric fingerprint’ of the soils under study (De Meijer, 1998). And this fingerprint can be used to translate the radionuclide concentrations into the soil property under study. The data in Figure 2 shows the use of this principle. The gamma spectrometer data shown in the left of Figure 2 were taken on a large agricultural area in Spain (van Egmond and Koomans, 2016). The aim of this specific measurement was to produce a quantitative ‘fines’ (clay) map of the area. To do this, a number of soil samples were collected in the area. Each sample was then analysed in a laboratory on radionuclide content and on grain-size distribution. In this case it turned out that the 232Th concentration turned out to be a very good4 predictor for the fine fraction (<63 micron) in the soil samples (middle part of the figure). Using the correlation found, the field data were translated into a clay map (right part).
3 The Dutch connection? For historical reasons, two of the biggest scintillator crystal providers find their origin in the Netherlands. Bicron (now St Gobain) and Scionix are both rooted near Utrecht and accordingly quite some scientific and commercial activities that incorporate scintillator tech, are found in the
Netherlands.
4 A R2 > 90% was found in this case.
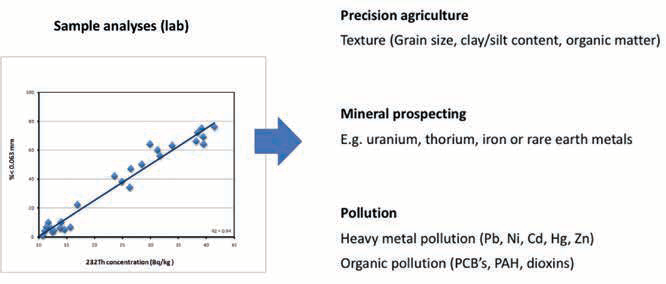
Figure 3 The image shows an example of how a radionuclide concentration (in this case 232Th) can be used to predict a soil parameter (here; the clay fraction).
In this case, the correlation between radionuclides and soil parameter is pretty well understood – clays contain more nuclides than sandy soils. In general it is found that radionuclide concentrations have proven to be an excellent proxy for soil texture (Van Wijngaarden et al., 2002) (median grain size, clay/sand content, organic matter content) and associated properties. This finding is attracting a lot of attention in the pedometric community and has led an increase in the use of gamma-ray mapping as a tool in precision farming.
The use of radionuclide concentrations as a proxy is not limited to soil texture alone. The same principle is used a lot in mineral prospecting and in recent years also in soil and sediment pollution studies (Van der Graaf et al., 2007). It has been shown in several works that radionuclide concentrations can be used as a predictor for heavy-metal pollution, mineral spoils, (dredged) sediment transport, etc (c.f. Figure 3).
7. Designing the optimal drone-borne gamma-ray
system
As noted, gamma-ray detectors are passive systems. They are made to record whatever radiation enters the crystal. This has one simple implication: ‘the bigger the crystal, the higher the yield’. Bigger is better. A large system simply captures more radiation than a small one and in real life applications the factors limiting the amount of crystals are payload limits and sensor price.
In classic, vehicle-borne or manned airborne gamma-ray surveys, payload is not considered a big issue and much of the price of a survey is determined by the platform price (i.e. operational costs of plane and personnel) and not so much by the sensor price. Moreover, for certain (regional) survey assignments large (32 or 48 litre) assemblies or crystal packs are mandatory.
However, for drones the situation is completely opposite. Payload is probably the biggest issue for drones and the platform (the drone) can be low cost. Gamma-ray survey systems weighing several 100 kg and costing several hundred thousands of dollars are not an option. In other words, for efficient use as drone-sensor, gamma-ray systems need to be highly optimized in weight, size, shape and efficiency. This in turn requires a careful sensor design that can only be done using modern, computer modelling based design tools.
8. Types of drones
There exists a huge variation in the types of drones that are (anticipated to be) used in geosurveying, ranging from ultralight camera-drones used for photogrammetry to heavy, petrol-driven drones that have several 10s of kg payload capacity. The usability of the different drones is governed by regulations that differ by country and sometimes even within different regions in a country. However, in the last few years standards have emerged on classes of drones that can be used effectively, at least in western countries. In the Netherlands, limited (non-commercial) use is allowed up to 25 kg total drone weight and for commercial flying, 150 kg is the limit. In Canada, for instance, similar limits apply (Government of Canada, 2019), you need special permits to fly a drone heavier than 25 kg. In most countries a RPL (Remote Pilot Licence) is mandatory, and many countries use different classes of licences for lightweight (typically below 5-7 kg) and heavier drones.
In geophysics there seems to be no real consensus yet on the type of drone to be used. Some people are experimenting with big petrol-driven drones, others are looking at ‘off-the-shelf’ platforms like the DJI-600 (max payload: 6 kg) or the Tarot T18 (8 kg payload). Another class of drones that may become an interesting option for geophysics are devices that are used in agriculture to apply pesticides to crops. These drones often have payloads of 10-15 kg at flying times of several tens of minutes while still maintaining a total weight below 25 kg.
9. A radiation detector for each drone?
The relatively small payload of the drones discussed raises the question: is it possible to do gamma-ray surveys with them? Can a detector be made lightweight enough for these drones and at the same time still be efficient enough to produce reasonable results?
To make radiation detectors more efficient one should optimize the type, size and shape of a detector, and at the same time optimize the algorithms used to extract radionuclide concentrations from the measured spectra.
| Detector type | 5x6 BGO | 3x8.6” CsI | 3.5x6.5” CsI | 3.5x13” CsI | 4x4x16” CsI | 4x4L NaI Pack |
|---|---|---|---|---|---|---|
| Volume (ml) | 1931 | 996 | 1025 | 2050 | 4198 | 15992 |
| Crystal weight (kg) | 13.7 | 4.5 | 4.6 | 9.2 | 18.9 | 62.1 |
| Shape | cylinder | cylinder | cylinder | cylinder | square | square pack |
| Sensitivity (cps per ppm) | 46.4 | 26.4 | 25.6 | 50.4 | 79.2 | 224 |
| % in 2360 keV peak | 9.37% | 4.55% | 4.93% | 5.35% | 6.05% | 5% |
| Sensitivity per kg crystal material | 3.36 | 5.76 | 5.56 | 5.44 | 4.9 | 3.6 |
| Relative efficiency w.r.t. 4x4L NaI pack | 93% | 160% | 154% | 151% | 136% | 100% |
Table 2 Sensitivity of a set of detectors inside a cubic 232Th source. (*The resolution is defined as the peakwidth at 667 keV (137Cs)).
10. Size and shape do matter
Optimizing detector design has become a relatively straightforward job with the advent of so-called nuclear particle transport simulation codes (Waters et al., 2007). These codes were developed for the nuclear industry (nuclear power plants, medicine) and allow for the simulation of a detector’s response to a source of any size, shape and activity. MCNP-X, as an example, has proven to be an invaluable tool for selecting the right sensor for drone-borne systems at Medusa.
To show this, consider the following study in which we compared a number of gamma-ray detectors to a rectangular ‘pack’ of 4 NaI detectors having a total volume of 16 litres. This packed configuration has become the de facto standard in airborne surveying, but the configuration is not necessarily the most efficient one – neither in terms of photopeak efficiency5 as in terms of sensitivity6.
The best sensor for a drone is the one that has the highest sensitivity per weight unit. To get a better understanding of the interplay between volume, shape and crystal type, we estimated the sensitivity of a number of readily available detector types (see table 2) and compared it with the standard 16L pack. We used MCNP-X to simulate the responses of the sensors listed in the table below against a 232Th source. The source was modelled as a SiO2-filled cube surrounding the detectors, with density 2.32 kg/l, and an activity of 1ppm Th. In the simulation, several billion ‘decays’ were generated, and the gamma photons were followed on their way through the source and detector material. The result of such a simulation is a detector-specific energy spectrum. The sensitivity data below was extracted from these spectra by summing all counts between 300keV and 3MeV. The percentages in the 2360 keV peak were calculated as sum from 2410 keV to 2810 keV. For a full description of the MCNP-X procedure, see e.g. Van der Graaf et al, (2011).
The numbers in table 2 reveals some interesting things:
• CsI has the highest sensitivity per unit detector mass of the crystal types listed;
• The photopeak efficiency is largest for BGO;
• Cylindrical crystals have a higher sensitivity per unit mass than rectangular ones – up to a factor 1.6 w.r.t. the standard airborne NaI system.
It is probably not a surprise that the virtual experiment listed above is very helpful in finding the right detector for the job. Being able to run simulations like these has become a very important tool in gamma-ray detector design for geophysical purposes.
However, size, shape and detector type are not the only parameters the system designer can play with. Another important step in improving detector efficiency is the use of full spectrum processing.
5 The photopeak efficiency of a detector is the probability that a gamma photon that enters the detector is fully absorbed and adds to a peak in the energy spectrum.
6 Detector sensitivity or ‘yield’ is the number of events (counts) per second a detector registers facing a certain source. It depends on a sensor’s volume, shape and crystal type.
11. Spectral fitting
The classic approach to retrieve radionuclide concentrations from gamma-ray spectra is by applying the windows or three-windows method (Nicolet and Erdi-Krausz, 2003). In windows a relatively small part of the operation basically uses the counts collected in three energy intervals that coincide with the position of the 40K peak, and the high-energy peaks of 238U and 232Th as a measure for source strength or, in other words, for the concentration of the radionuclides.
By using only peak counts, a large part of the spectral data is thrown away (see Figure 2). To improve the quality of the data retrieved from gamma-ray spectra, several noise-reduction techniques were developed (Hovgaard and Grasty, 1997). Although very successful in improving gamma-ray data quality, these techniques are empirical by nature. They assume a certain smoothness of the dataset (spectra that are measured consecutively and look alike) and they hold a certain risk of throwing away generic data as noise.
Another route to improvement is by using more of the spectral data itself. This was already recognized in the early Eighties, for instance by Grasty et al. (1985), who proposed a multi-window approach rather than the limited 3-Windows method. However, at that time computing power was lacking to perform multi-window or Full Spectrum Analysis (FSA) on large, multichannel datasets. But some ten years later, computers have become powerful enough to allow for FSA, even to analyse live spectral data, for instance while logging.
It took another 10 odd years, however, before the FSA method became usable on a production scale. This change was again connected to the nuclear particle simulation codes becoming available for source-detector modelling. The simulation codes enable the construction of so-called standard spectra: energy spectra a detector would measure on a source with unit activity of 40K, 232Th, 238U or another (man-made) gamma-emitter. The simulated response curves were used to develop a very clean and simple calibration method for gamma-ray detectors – a method that could replace for instance the pad or borehole calibration methods (Van der Graaf et al, 2011) used for airborne or borehole spectral gamma tools.
The FSA method itself (and its extensions) has been described in several papers and reports and it has been shown that the method improves the data precision7 by at least a factor of 2 (Hendriks et al, 2001). The significance of this improvement becomes evident when one remembers that for gamma-ray spectra, uncertainties scale with the square root of the spectrum content. In other words, better statistics through better analysis allows for faster measurements and/or smaller tools. And the effect is large: reduction of uncertainties with a factor of 2 allows for a detector that is four times smaller.
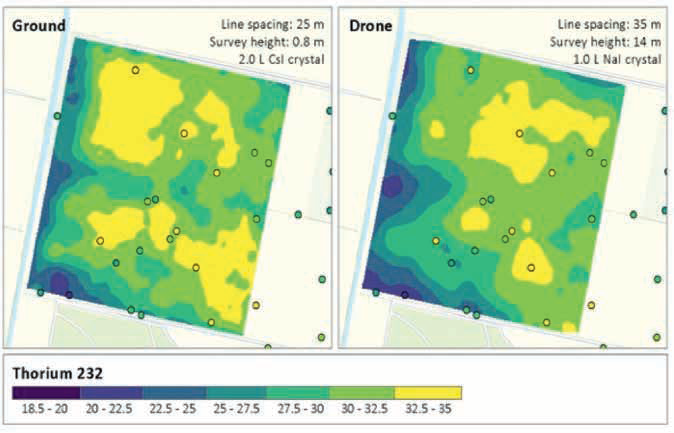
Figure 4 Comparison of the resulting 232Th concentrations for ground and drone measurements, the detector is placed at 0.8 and 14 m heights above the ground respectively. Note that the absolute concentrations match and the resolution of the drone measurements decreased. This deterioration is expected due to an increase in distance from the ground resulting in an inevitable loss in resolution. The circles represent the soil samples that have been analysed in the laboratory. 232Th values in Bq/kg.
7 In this context, Precision is a measure for the (statistical) spread in the concentrations found.
12. Drone-borne surveys – best practice and examples
Precision farming
One of the application areas for drone-borne measurements is in agricultural mapping. Drones are increasingly being used to map cropfields, using hyperspectral cameras (to monitor quality of crop) and lidar or photogrammetric systems to establish DTMs. At the same time, vehicle-borne gamma-ray systems are used more and more for texture mapping, sometimes as addition to traditional EM mapping but more often as replacement. Droneborne gamma-ray therefore is an obvious next step in cropfield mapping.
In a collaboration with Wageningen Environmental Research, a project was done to test whether a lightweight drone-borne system can replace data taken on the ground (Van Egmond et al, 2018). In this project a cropfield in the Dutch province of Flevoland was mapped walking, using a MS-2000 CsI (a 2 litres CsI detector) and a drone-borne MS-1000 NaI (a 1 litre NaI detector, weight 6 kg). The drone (a DJI M600 PRO) was flying at an average elevation of 14 m. The survey lines were taken about 30 m apart. In addition, about 50 soil samples were taken and analysed in the lab on radionuclide content and clay fraction. The 232Th content shows excellent correlation with the clay fraction and was used to translate the field values of 232Th into a clay map.
Figure 4 shows the results. Although the ground measurement and the drone data match relatively well, the spatial resolution of the data taken with the drone is less than the data taken walking. This is expected as the drone sees a larger radiation area and thereby has a larger footprint (c.f. Figure 5). As a general rule, the radius of the ground spot the spectrometer sees is equal to the elevation it is flying at.
13. Mapping mine tailings
Another promising application domain for drone-borne radiometrics is to map areas that are inaccessible for people by foot or vehicles. An example of such an application was a project in which we mapped a mine tailing. The area under consideration was swampy and important parts were inaccessible by foot or by car. In order to avoid spill from the tailing, the area has to be monitored on a regular basis. Up to now, this was done by flying a helicopter survey at 80 m elevation using a standard 16L NaI pack of detectors – a relatively expensive operation given the small size of the area.
In a test we used a MS-1000 system (1 litre crystal) to map the area using a (petrol-driven) drone (see Figure 6). The system has been flying at 15 m elevation, at 10-15 km/h speed. The flying lines were spaced at 10 m. Figure 6 shows the survey area. In the south part, a mine-pond is visible of which the upper part has been filled with watery tailing sludge. The right side of the figure plots the (interpolated) 238U map of the area. A hot-spot8 is clearly visible, right on top of the inaccessible tailings.
Due to the inaccessibility of the terrain, this spot would have been difficult to find by a ground-borne survey. It might have been seen in the helicopter survey, but much less pronounced because of the minimum 80 m elevation the helicopter is flying at.
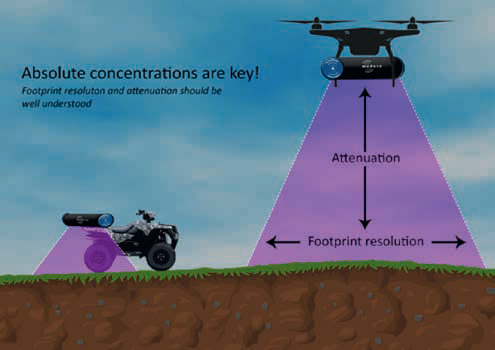
Figure 5 Difference in viewing area between ground and drone measurements. Due to the increase in elevation the effective spot size on the ground increases. At the same time due to the increased layer of air between the ground and the detector the signal will deteriorate.
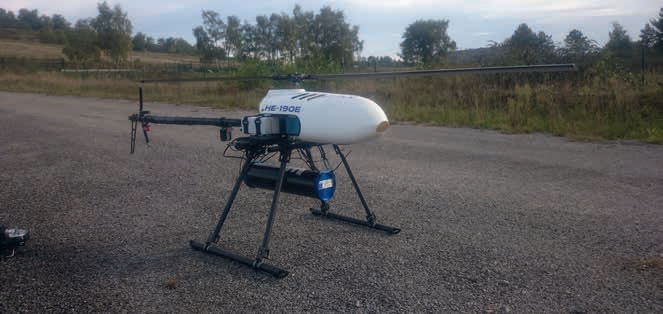
Figure 6 The petrol-powered drone used for mapping the mine tailing. Underneath the 1 litre MS-1000 gamma-ray sensor.
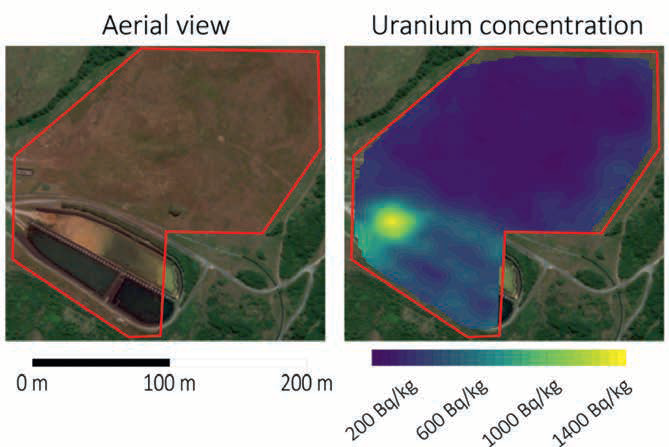
Figure 7 On the left: an aerial pic of the mine tailing area. In the south part the mine pond becomes visible. The right image shows the 238U map of the area, including a hot-spot right at the swampy part of the pond.
8 The term ‘hot spot’ should be interpreted in light of the surrounding 238U concentration. The hot spot has a concentration of about 1400 Bq/kg (about 120 ppm U). the surrounding area has 238U concentrations that are at least 10 times smaller.
14. Conclusions and outlook
Gamma-ray spectroscopy has a long-standing tradition as a tool in geophysics. The last decade has shown a remarkable rejuvenation of the application – a rejuvenation that was pushed both by developments in detector technology as well as a better understanding of the relation between radionuclide concentrations and soil/sediment properties. A significant part of this renewal has Dutch origins.
The latest addition to the gamma-ray toolbox is in the use of small unmanned airborne systems. The advent of drones has really pushed (and is still pushing) gamma-ray detector technology to downscale – both in weight as in power consumption. Nowadays sensible radiometric mapping can be done with detectors that weigh less than 7 kg instead of the bulky systems used in the past.
The challenge is to develop even lighter kit. The authors are working with groups at BGR (Hannover, Germany) and the Swedish University of Agricultural Sciences (SLU) to further reduce the weight and size of the sensors. The aim of the BGR collaboration is to create a lightweight drone system with very high spectral resolution, for mapping radioactive pollution in former mining areas9. The Swedish project aims at creating a baseline for use of small detectors in agricultural mapping.10
9 www.bmbf-client.de/en/projects/dubgem
10 www.youtube.com/watch?v=FEn8q6ImjmE
Acknowledgements
The authors would like to thank Fenny van Egmond (Wageningen University Research) and her group for supporting the development of drone-borne systems for agricultural use. We would also like to thank prof De Meijer for many fruitful discussions and Jon Holst (Geoduster, RSA) for his continuous support in the design of the lightweight instruments.
References
Grasty, R., Glynn, J. and Grant, J. [1985]. The analysis of multichannel airborne gamma-ray spectra. Geophysics, 50(12), 2611–2620.
Government of Canada [2019]. https://www.tc.gc.ca/en/services/aviation/drone-safety/get-permission-fly-drone-outside-rules.html.
Hendriks, P.H., Limburg, J. and de Meijer, R.J. [2001]. Full-spectrum analysis of natural gamma-ray spectra. Journal of Environmental Radioactivity, 53(3), 365–380.
Hovgaard, J. and Grasty, R. [1997]. Reducing statistical noise in airborne gamma-ray data through spectral component analysis. Proceedings of Exploration, 753–764.
Van der Graaf, E.R., Limburg, J., Koomans, R.L. and Tijs, M. [2011]. Monte Carlo based calibration of scintillation detectors for laboratory and in situ gamma ray measurements. Journal of Environmental Radioactivity, 102(3), 270–282. Doi: 10.1016/j.jenvrad.2010.12.001
Meijer, R. De. [1998]. Heavy minerals: from Edelstein to Einstein. Journal of Geochemical Exploration, 81–103.
Nicolet, J.P. and Erdi-Krausz, G. (2003). Guidelines for radioelement mapping using gamma ray spectrometry data. International Atomic Energy Agency. Doi: IEAE-TECDOC-1363.
Reinhardt, N. and Herrmann, L. [2019]. Gamma-ray spectrometry as versatile tool in soil science: A critical review. Journal of Plant Nutrition and Soil Science. Doi: 10.1002/jpln.201700447.
Van der Graaf, E.R., Koomans, R.L., Limburg, J. and de Vries, K. [2007]. In situ radiometric mapping as a proxy of sediment contamination: assessment of the underlying geochemical and -physical principles. Applied Radiation and Isotopes : Including Data, Instrumentation and Methods for Use in Agriculture, Industry and Medicine, 65(5), 619–633. Doi: 10.1016/j.apradiso.2006.11.004.
Van der Veeke, S., Koomans, R.L., van Egmond, F.M. and Limburg, J. [2019]. A Drone as Platform for Airborne Gamma-Ray Surveys to Characterize Soil and Monitor Contaminations. 24th European Meeting of Environmental and Engineering Geophysics, Extended Abstracts, Doi: 10.3997/2214-4609.201802510.
Van Egmond, F.M. and Koomans, R.L. [2016]. Multi Sensor Soil Sensing Tool for Farmland in Spain. 22nd European Meeting of Environmental and Engineering Geophysics., Extended Abstracts, Doi: 10.3997/2214- 4609.201601996.
Van Egmond, F.M., van der Veeke, S., Knotters, M., Koomans, R.L., Walvoort, D.J.J. and Limburg, J. [2018]. Mapping soil texture with a gamma-ray spectrometer: comparison between UAV and proximal measurements and traditional sampling. WOt-technical report 137, http://edepot.wur.nl/466037.
Van Wijngaarden, M., Venema, L. and De Meijer, R. [2002]. Radiometric sand mud characterisation in the Rhine–Meuse Estuary: Part B. In situ mapping. Geomorphology, 43, 103–116.
Waters, L.S., McKinney, G.W., Durkee, J.W., Fensin, M.L., Hendricks, J.S., James, M.R. and Pelowitz, D.B. [2007]. The MCNPX Monte Carlo radiation transport code. AIP Conference Proceedings, 896, 81–90.