
Benchmarking a small footprint detector system for airborne surveying
Introduction
Most traditional airborne gamma-ray survey systems comprise a minimum of four 4L sized NaI crystal packs, mostly completed by one 4L NaI crystal looking upward. Often, a multitude of such packs is used to assure sufficient detection efficiency at spectrum accumulation timescales of 1 second or less. The size and inherent weight of such packs (over 58 kg for a 4x4L system excluding housing and electronics) imposes a strict lower limit to the payload of the platforms used for airborne surveying, effectively blocking the use of small, lightweight platforms or even unmanned drones for surveying.
To allow further reduction of the “payload consumption” imposed by airborne gamma-ray systems, we have devised a novel measurement methodology that combines the use of a (much) smaller detector and the use of full spectrum data in the spectral analysis. In this study, we present a
comparison of airborne data taken using traditional survey equipment and at the same time taken using a single 4L CsI crystal. The aim of the exercise presented here is to compare the data quality taken with the lightweight CsI system with the quality of the data from a system taken as the
“industry standard” and to establish guidelines for the applicability of small detector systems in airborne surveys.
The experiments
Two actual field experiments were conducted to obtain a valid dataset to be used in the comparison. The first test was conducted on the 17th of February 2010. In this test, a 4L CsI Medusa spectral gamma tool was placed close to an industry standard system consisting of 4x4L downward looking detectors and a single 4L upward looking detector for radon measurement. The test comprised a small one-day survey over an area at the German Waddencoast, close to Wilhelmshaven.
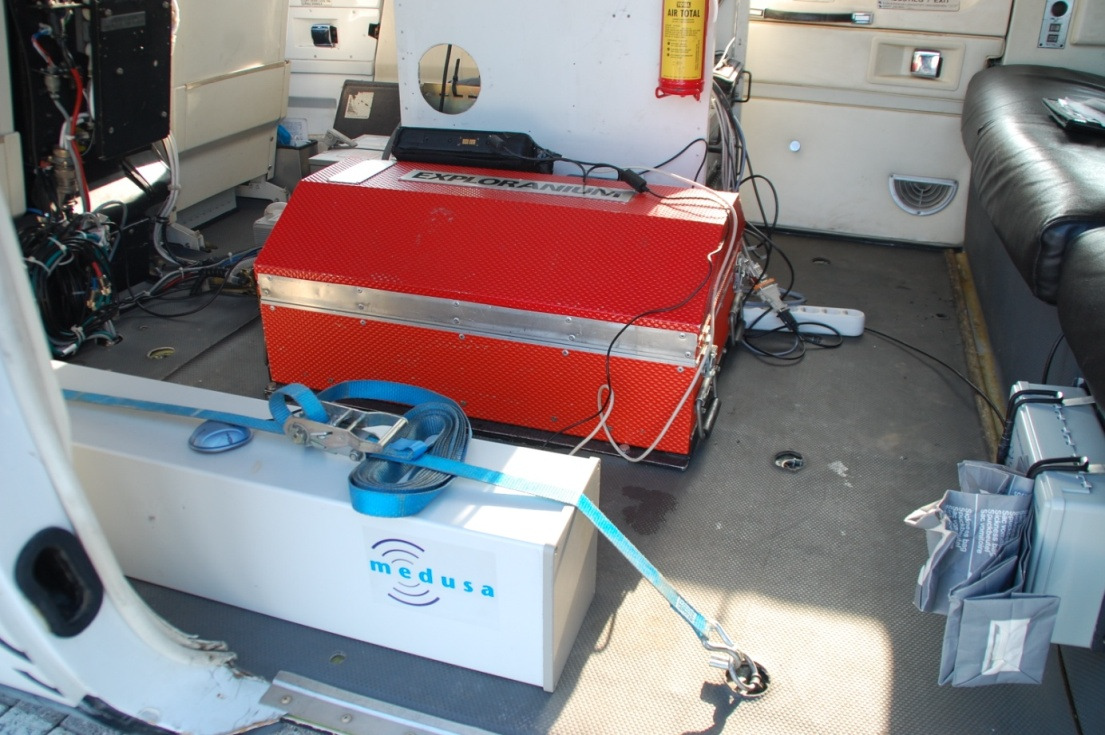
Figure 1: Medusa sensor beside the (red) 16L system, mounted inside the BGR geophysical survey helicopter platform.
The second test was conducted in the south-west of France, near the city of Niort. This test was done in collaboration with Terraquest Ltd (Ca) and comprised a one-day survey of an area about 50 kms to the south-east of Niort. A 4L Medusa CsI system was mounted inside the Terraquest Piper Navajo. The plane also contained three “standard” 16L NaI packs. All systems were readout simultaneously. The spectra of the standard packs were summed into one resulting spectrum.
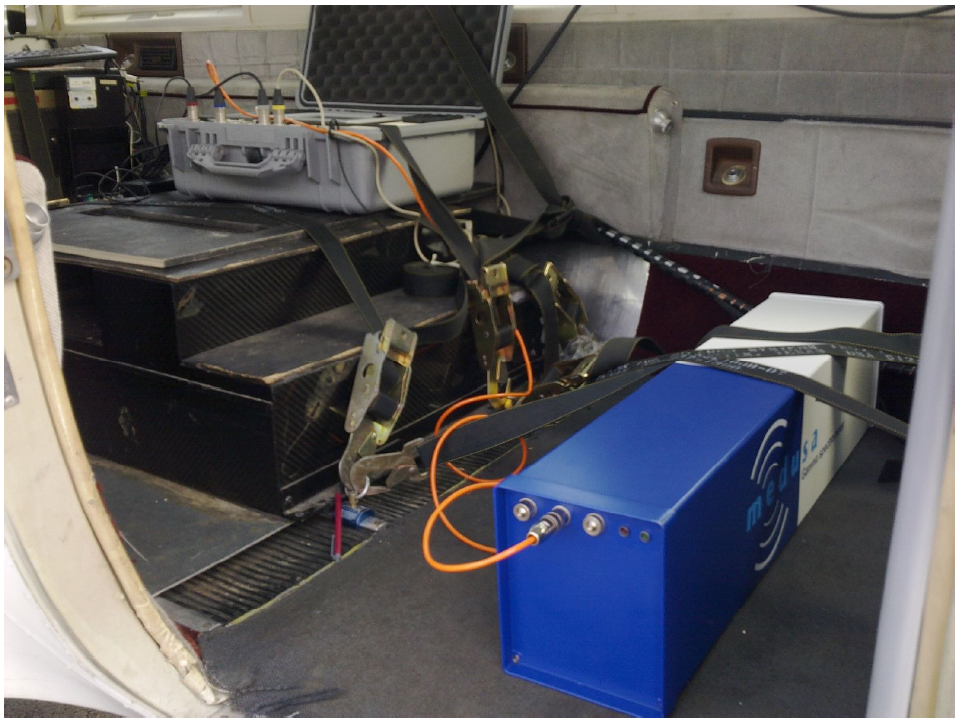
Figure 2: Medusa system (right) mounted next to one of the 16L systems (black box on the left)
Systems and data analysis
Hardware setup
The hardware and settings used in the tests are listed in the table below.
Table 1: Hardware settings used in the tests
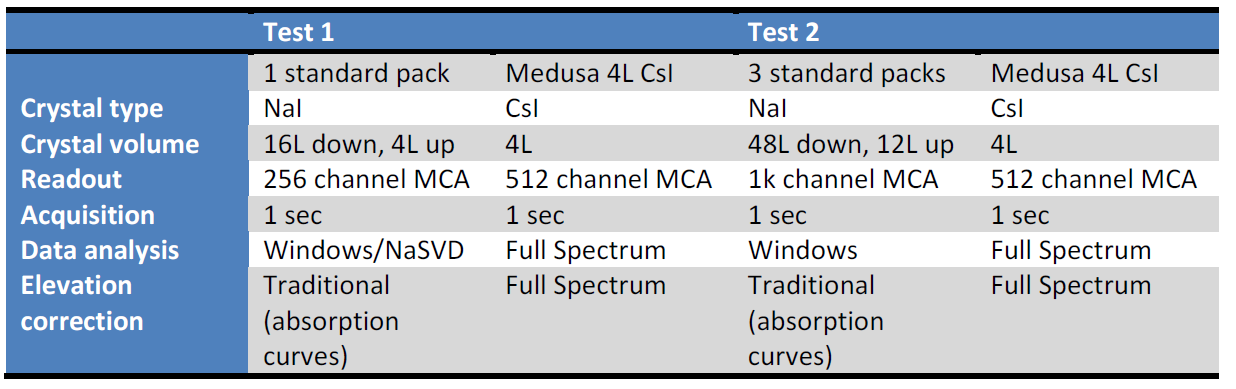
In both tests, each individual system was readout by its own data acquisition system. Apart from spectral information, the reference systems also provide raw channel count rates for the 40K, 238U and 232Th channels. Auxiliary channels included were, amongst others, position information (taken from GPS systems) and elevation (in both cases measured using a radar altimeter). Spectral data is stabilized against temperature drift by device-internal hardware.
The Medusa system logs raw (unstabilized) spectral data together with a number of auxiliary data channels. A GPS was used for positioning. The Medusa data was synchronized to the elevation and positioning information of the BGR- and Terraquest platforms using the GPS clock as a marker value. In this way, the Medusa and the reference systems data were lined out along identical flight paths.
Data processing
The data from the reference packs were pre-processed using Geosoft Oasis Montaj software. Then, the spectra were imported into Medusa’s GAMMAN software. GAMMAN is a package that allows both “standard windows” processing of full-spectrum data, according to the guidelines proposed by the IAEA, and full spectrum processing of software.
The reference data were processed using the standard 3-window method described before. No averaging or NASVD noise reduction methods were used. The Medusa data were analyzed using the full spectrum analysis (FSA) mentioned before.
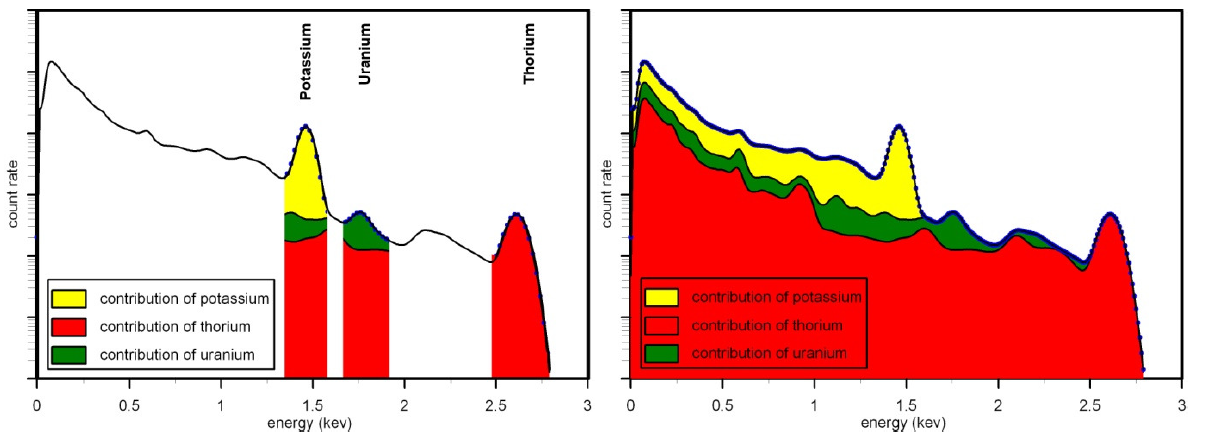
Figure 3: In windows analysis (left graph) only part of the gamma spectrum is used for analysis. In full spectrum analysis, the complete spectrum is used.
In short, FSA performs a least squares fit of a set of normalized detector response spectra to each measured spectrum (figure 3). These response spectra, or – in short – standard spectra, are the responses of a given detector system in a given geometry to a source of 1 Bq/kg of one of the naturally occurring radionuclides 40K, 238U or 232Th. These response curves are obtained using Monte Carlo type nuclear particle transport simulations. The FSA code typically operates over the energy interval between 300-3000keV, and takes all spectral information in this range into account.
In airborne FSA, the fitting algorithm uses sets of 40K, 238U and 232Th standard spectra unique for each flying height found in the dataset. The range of “valid” elevations is between 0 and 160 m elevation.
Elevation correction for the reference systems was done using standard absorption models described by IAEA. All data were referred back to zero elevation (“ground concentrations”). No radon corrections were performed to avoid introducing additional uncertainties in the data analysis.
Results
Statistical analysis
Before data from the different airborne systems can be compared, one should decide on what to use as a measure of data quality and/or efficiency of the detector system under investigation. An often used, rather straightforward way of comparing detection efficiency in airborne applications would be to compare the channel count in the 40K, 238U, 232Th and total count channels. However, since the analysis methods used in the small footprint Medusa system intrinsically differ from the windowsbased analysis used in industry, such a comparison is not fully sound. A more realistic approach would be to compare the results after data processing. In this way, both the detector response and the strength of the analysis method applied is revealed. The (relative) statistical uncertainties in the ground concentrations of 40K, 238U and 232Th found in the respective datasets are a perfect measure of the quality differences between the systems.
For radiometric data, the aforementioned statistical uncertainties can be obtained in two ways:
1. Via statistical uncertainties in the individual spectra. As described above, the FSA method is based on a chi-squared fit of the measured spectra. The method not only yields (ground) nuclide concentrations, the uncertainties in the concentrations found are also a result intrinsic to the method. The “windows” method also allows to calculate uncertainties, simply by using the statistical uncertainties of the count rates found in the energy windows. In theory, also the uncertainties in the stripping factors applied should be accounted for but for simplicity we disregard those here and assume their contribution to the overall uncertainty negligible.
2. Via a geostatistical assessment of the spatial variation in the data taken in the survey areas. Geostatistics applied to the datasets will reveal which part of the variation found in the spatial images stems from variation in the geology, and which part stems from uncertainties intrinsic to the system used.
In the following, we will apply both methods to compare the datasets. In the following tables, we summarize the nuclide concentrations and uncertainties found in both surveys.
Table 2 shows the average nuclide concentrations, statistical uncertainties and geostatistical uncertainties in the BGR survey in Germany. These results show that the uncertainties for 40K are smaller in the 16l standard pack than in the 4l Medusa pack. For the concentration of 238U, uncertainties are similar, for 232Th the uncertainties are smaller in the 16l standard pack. Apparently, 16 l NaI pack with windows analysis gives more accurate concentrations of 40K and 232Th, but the uncertainty in the 238U concentration is similar for both set ups.
Table 2: Average nuclide concentrations, statistical uncertainties and geostatistical uncertainties in the BGR survey in Germany
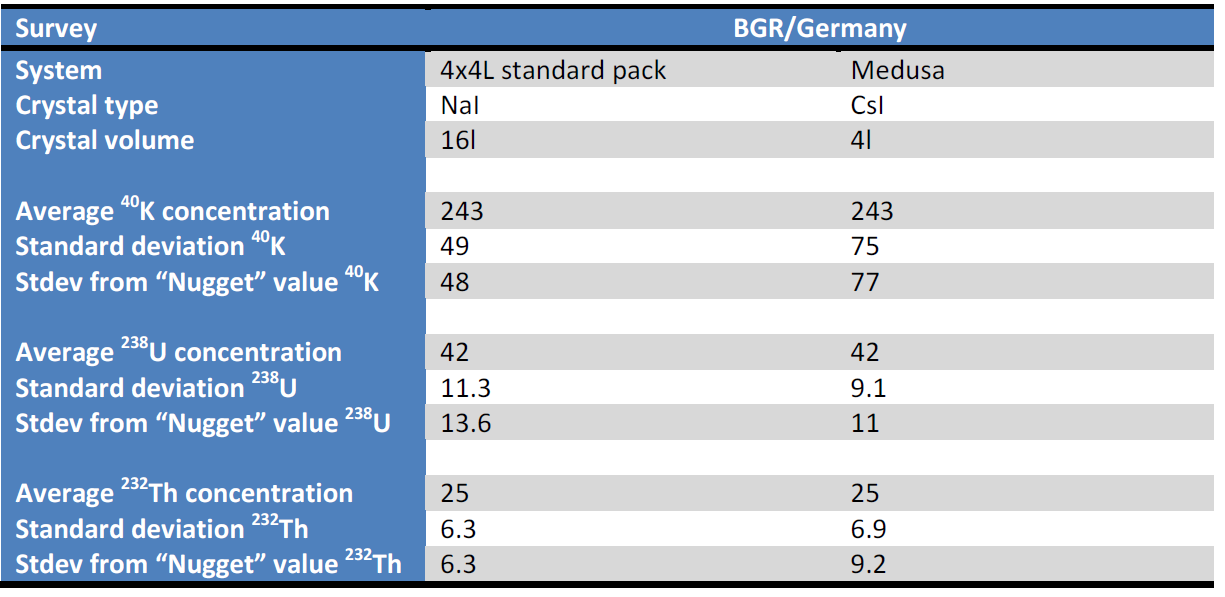
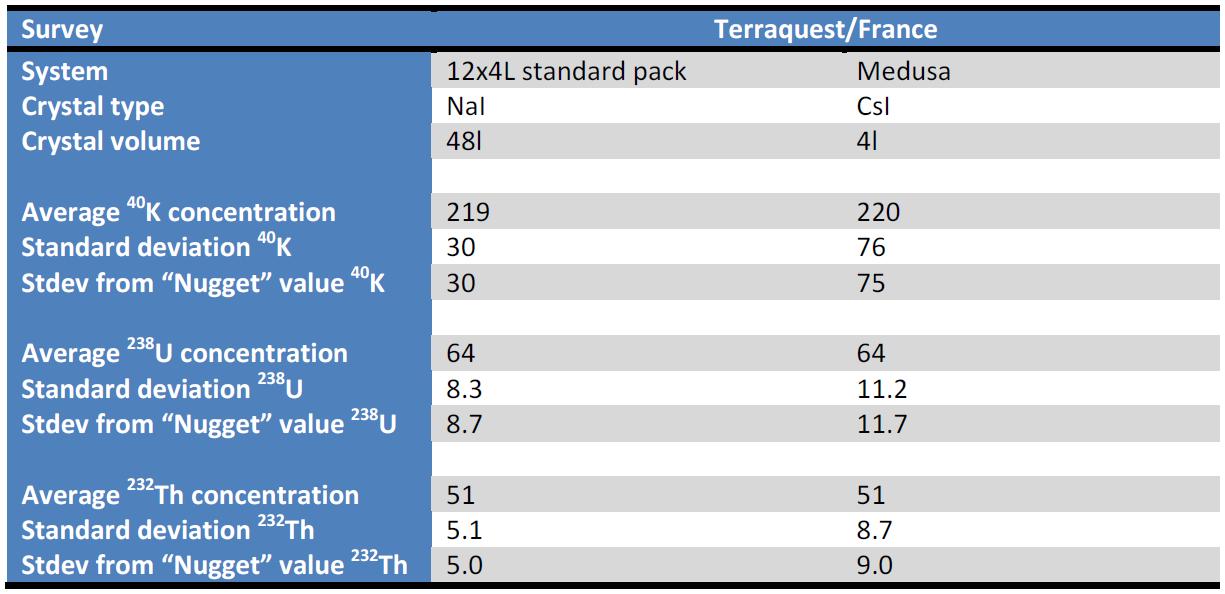
Table 3 shows average nuclide concentrations, statistical uncertainties and geostatistical uncertainties in the Terraquest survey in France. These results show that, for all nuclides, the uncertainties in the concentrations are smaller for the 48l NaI standard pack than for the 4l CsI pack. Which is expected considering the large size of the standard pack. The uncertainty in the 40K concentration is a factor of 2 larger, the uncertainty in 238U is a factor of 1.3 larger and the uncertainty in 232Th is a factor of 1.7 larger. Apparently, similar to the BGR test, the ratio in uncertainty between both systems is not a constant, but differs per nuclide.
Table 3: Average nuclide concentrations, statistical uncertainties and geostatistical uncertainties in the Terraquest survey in France
Maps
The test site of the BGR survey is mainly built up of Holocene deposits of light to heavy, fine-sandy clay-deposits and fine sands and was homogeneous in character. The maps do not show any variation and are therefore not presented.
The test site of the Terraquest survey in the area between Poitiers and Limoges in the southwest of France lays in the geological province of the Aquitane basin. Sediments in this deep foreland basin of the Pyrenees have been deposited from Triassic (251 million years ago) until the Pleistocene (ice ages about 1 million years ago) and consists mainly of marine deposits (limestone, salt, clay and fine sand) and in particular areas of deposits coming from the uplifted Pyrenees in the south, starting in the Eocene some 50 million years ago (sandstones, conglomerates). In the small area where the measurements have taken place, the upper part of the soil consist in the north (near Saint-Martinl’Ars) of residual and redeposited loams from silicate rocks. In the other part of the zone further south (until Ambernac) the soil consists of residual and redeposited clays from calcareous rocks. Near Alloue there is a small zone with fluvial clays, silts and loams.
The maps in figure 4 and figure 5 show the data taken with the Medusa system and the Terraquest system. The data are interpolated using triangulation, thereby reflecting all statistical noise present in the dataset.
Inspection of the images below lead to a number of observations:
1. The overall geological structures are clearly visible in both datasets;
2. The triangulated Medusa data are somewhat noisier than the Terraquest data; especially in the 40K channel but not so much in the 238U channel;
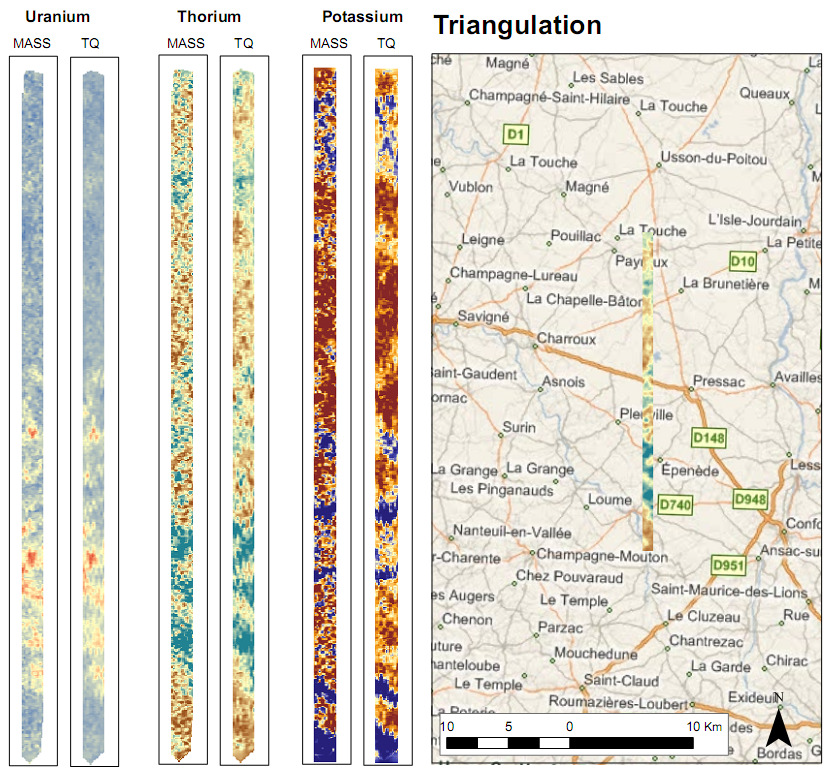
Figure 4: Maps of Interpolated 238U, 232Th and 40K data, Terraquest survey, France. The left maps stem from the Medusa system, the right maps from the Terraquest system. Interpolation based on inverse-distance smoothing of data.
In the presentation of geographically spaced data, often noise is reduced by using interpolation techniques. Kriging is such an interpolation technique that allows for incorporating a model of the statistical uncertainties in the dataset. Kriging is a smoothing interpolator and reduces the effects of small-scale variability between neighboring data points. This method allows for introducing smoothing factors based on the uncertainty in the dataset.
Figure 5 shows the Kriging interpolated maps of both systems. This figure shows that the kriginginterpolated Medusa image is virtually equal to the Terraquest image.
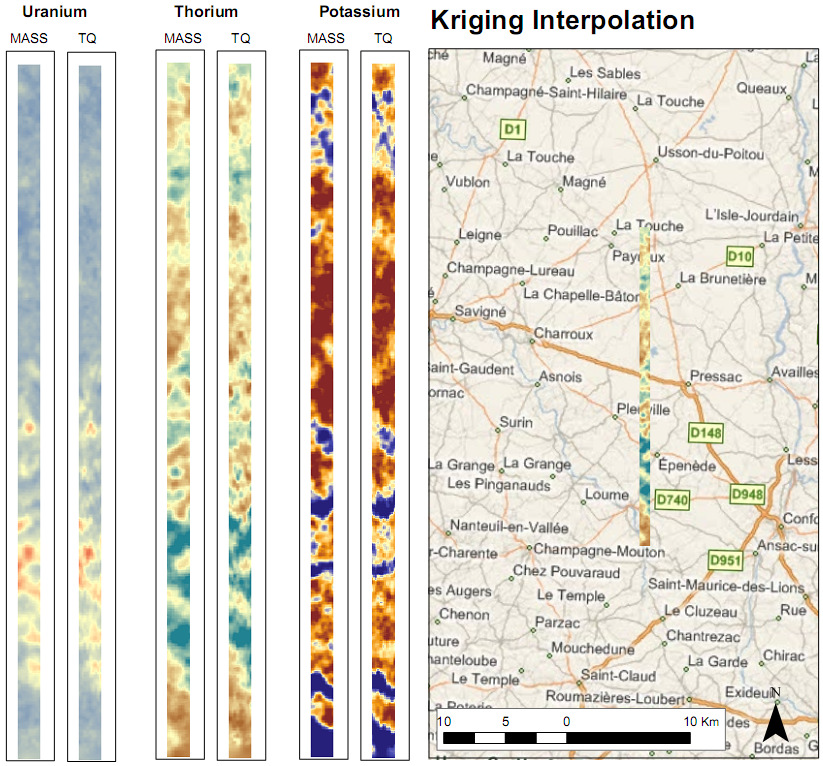
Figure 5: Maps of Interpolated 238U, 232Th and 40K data, Terraquest survey, France. The left maps stem from the Medusa system, the right maps from the Terraquest system. Interpolation based on kriging.
Discussion
Since this paper deals with reducing detector size (and weight) for airborne gamma-ray survey systems, it seems appropriate to discuss the results presented before in terms of measured efficiency (derived from the tables above) versus those expected purely on a detector volume basis. Normally, detector efficiencies are defined in terms of their count rate against a certain source. Hence, the efficiency scales with detector volume and opening angle. Another method to compare efficiencies is to list them as the square of the ratio of the uncertainties1 in the nuclide concentrations. Table 4 lists the results of this comparison for the systems under study.
---------------------------------------------
1 The statistical nature of natural radiation measurement leads to a square-root scaling of the uncertainty in channel count rates (and thereby in the nuclide concentrations derived from them) with the number of counts.
Table 4: Relative efficiency (i.e. efficiency Medusa/efficiency reference) for both surveys.
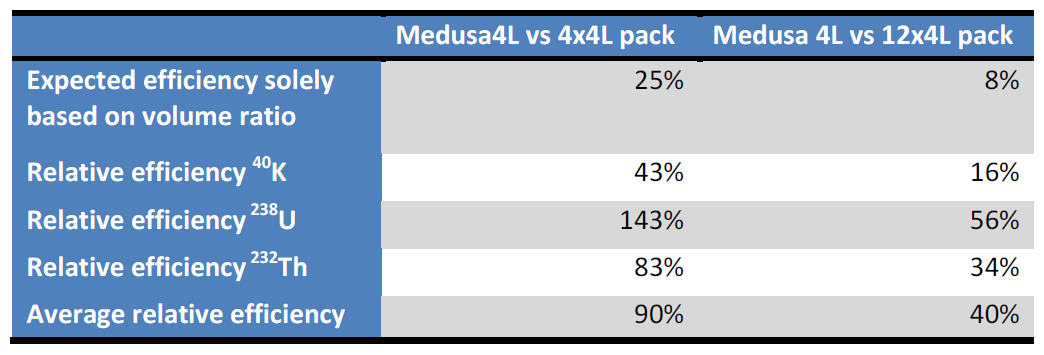
As one can infer from table 4, for all nuclides the relative efficiencies are larger than expected purely on a volume basis. The average efficiency of a Medusa 4L system is almost comparable to a 4x4L standard pack. However, for the individual nuclides the relative efficiency differs. The relative efficiency of 40K is lowest (43%) but still much better than expected on volume ratio. For 238U the efficiency of a Medusa 4L system is even 143% compared to the efficiency of a standard 4x4L pack. As expected, compared to a 12x4L pack, the relative efficiency averaged over all nuclides below 1. However, for all nuclides the relative efficiency is (much) larger than the expected value of 8%. The high relative efficiency of the small Medusa detector with respect to the reference systems originates from:
1. The difference in crystal material. CsI has a higher density that NaI, yielding better photopeak efficiency especially for the high-energy 232Th and 238U peaks;
2. The difference in opening angle of the Medusa system and the reference systems. The crystals inside the reference detector packs partly shield each other, an effect not present in the Medusa system;
3. The full spectrum analysis method performs particularly well on the 238U channel. This can be understood from its spectral structure; uranium has numerous distinct peaks over the full energy range of the spectra. A full-spectrum approach takes all information from these peaks into account, in contrast to (classical) windows analysis.
To compare the data from both experiments, the relative efficiencies (table 4) are normalized with respect to the volume based relative efficiencies (i.e. relative efficiency/relative efficiency based on volume). The resulting values are presented in figure 6. For the Medusa system to be up to par with the reference systems, the normalized relative efficiency would need to be 100%. However, on average the normalized efficiency of the Medusa system is 370-440% with respect to the reference systems. The ratio’s differ strongly for the individual nuclides, though. For 40K, the gain is relatively small (180%) but for 238U the gain can be almost a factor 7! For 232Th the average gain is 380%.
----------------------------------------------------------------------------------------------------
To improve “counting statistics” by a number of two, one would need four times the detector volume. Efficiency can be defined as the ability of a sensor to measure a nuclide concentration within a certain measurement time. The efficiency is calculated as the square of the measured uncertainties.
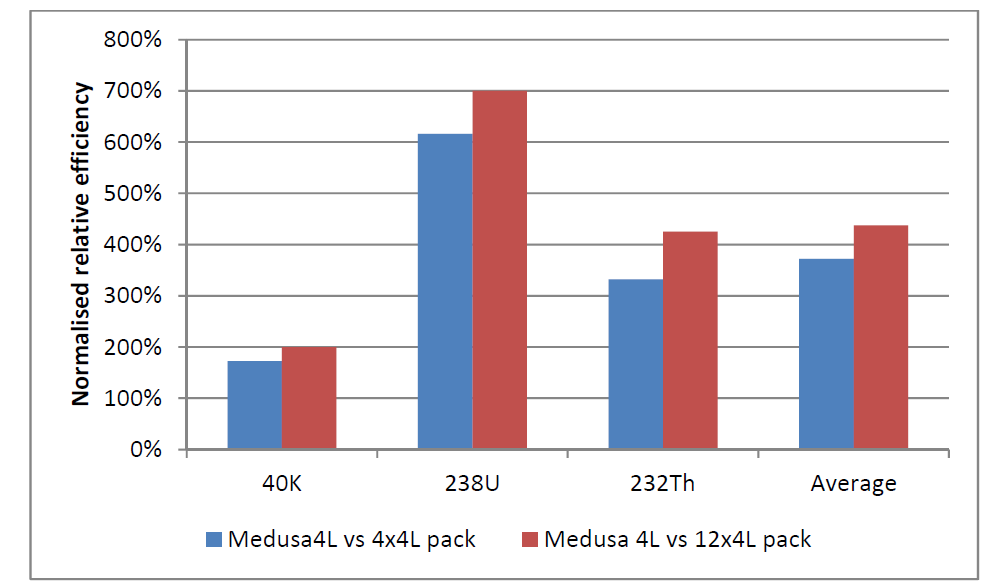
Figure 6: Normalized relative efficiency of the Medusa system compared to the reference systems.
The aim of this paper is to investigate how much the volume (and mass) of a detector system can be decreased without losing efficiency. To highlight this, table 5 lists the volume the Medusa sensor should measure to be up to par with the 16L and 48L reference systems. This volume can be estimated by the normalized relative efficiency times the volume of the reference system.
Table 5: Medusa volume needed to be up to par with reference systems.
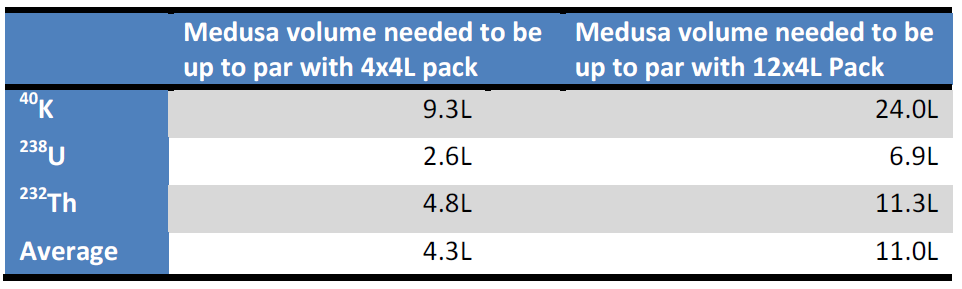
Table 5 shows that for 40K, the amount of crystal needed is 9.3L to be up to par with the 16L reference system. For 238U, the situation is quite extreme; one would only need 2.6L of Medusa crystal to be up to par with the 16L reference system.
Conclusions
To determine whether the “payload consumption” imposed by airborne gamma-ray systems can be reduced, a novel measurement methodology is compared with two reference systems used for airborne gamma spectrometer surveys.
The novel system is a 4L CsI crystal combined with full spectral data analysis; the standard are multiples of 4L NaI pack combined with IAEA-recommended windows analysis. Improved data analysis on the traditional packs, including techniques like PCA, NASVD or multi-windows, has not been included in this study.
The experiments show that the small system outperforms the big reference systems. The small system has almost similar efficiencies as a 4 times larger traditional system. Especially in the measurement of 238U, the novel approach can impose a 700 % increase in efficiency.
The statistical nature of gamma radiation dictates that doubling detection efficiency squares the detector volume needed. However, this argument can also be reversed; if one would increase the efficiency of a system by using a different detector material together with more of the spectral information present; one could decrease the volume needed accordingly. We have shown here that to replace a classic 4x4L system without compromising efficiency one would need a CsI-based Medusa sensor with a volume between 2.6L (for 238U) and 9.3L (for 40K). Even in the worst case a weight reduction of almost a factor of 2! The actual crystal size to choose of course depends on the nature of the area to be surveyed. But the promise of strong reduction in payload and the associated reductions in cost and environmental impact, justifies a thorough and honest evaluation of the sensor configuration needed – an evaluation that may profit from the numbers presented in this paper.