The 𝛾-ray spectrum
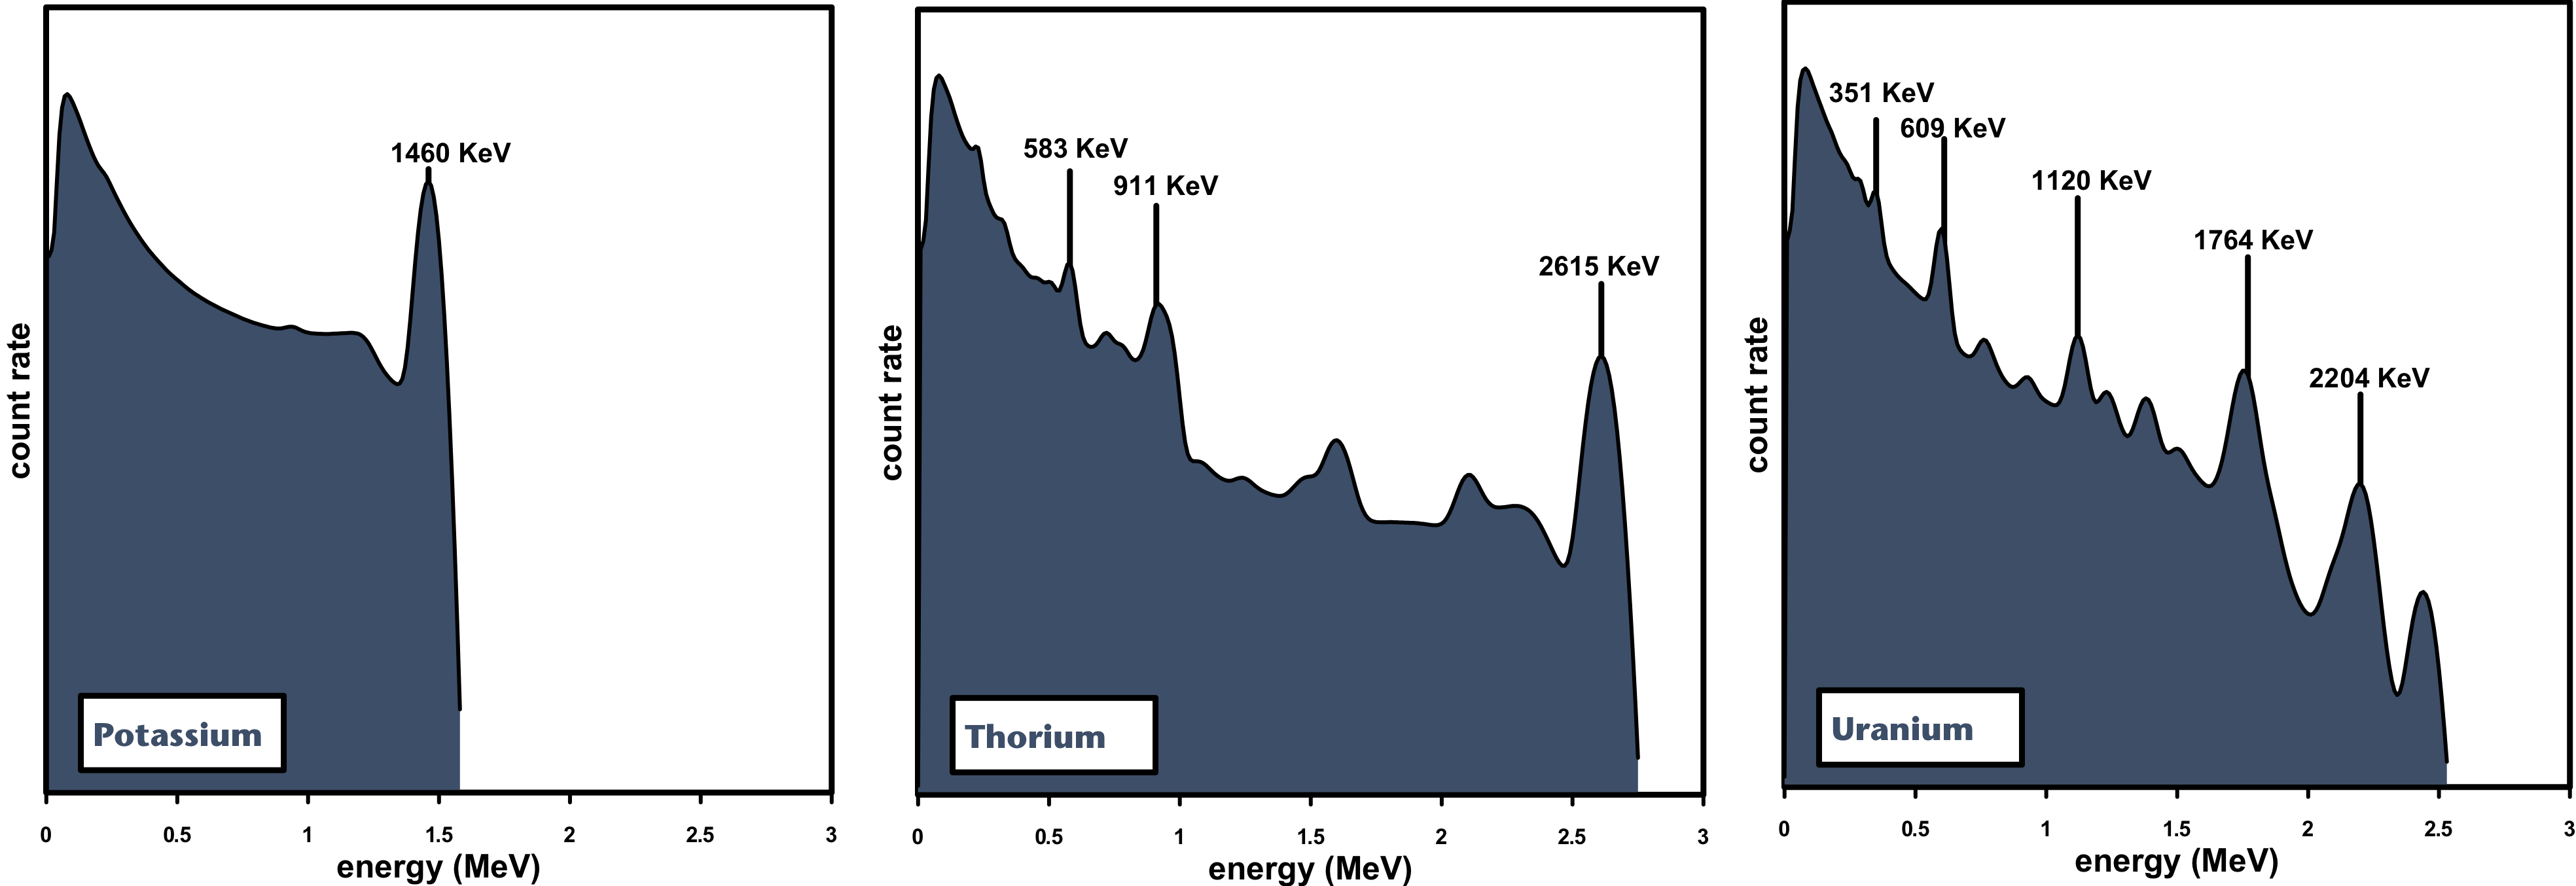
The Figure (Gamma spectrum mono energetic source.png) in the section Interaction of 𝛾-radiation and matter describes the shape of an E𝛾-spectrum, resulting from a mono-energetic source. In nature, however, 𝛾-photons with different energies are emitted and the 𝛾-energy spectrum will be more complex than the one described in Figure 3.2. When photons from a source with different energies hit a 𝛾-ray detector, the measured spectrum will be composed of a number photo-peaks and different Compton continua. Since the natural decay series of 40K, 232Th and 238U emit 𝛾-rays with different energies, a 𝛾-ray spectrum of natural sediment will contain various photo-peaks.

Typical response curves for natural radionuclides
Depending on the resolution of the detector system, the information in those 𝛾-ray spectra can be translated in the activity concentrations of the different radionuclides either by photo-peak analysis or full spectrum analysis (FSA).
{}
