
Radon in boreholes
Introduction
This report describes a detailed investigation into spectral gamma logs obtained in a uranium survey project in XXX. The investigation was triggered by a number of observations made by the field engineers of XXX and results from core sample analyses done on material from these boreholes. The main “puzzle” that came out of the field observations and sample analyses was, that the gammaray logs showed (very) high 238U content in parts of the boreholes. At the same time, the core samples turned out to contain hardly any uranium. Also, the radioactivity of the winch system connecting the borehole spectral gamma tool to a survey computer was measured shortly after having run an upward borehole log. This measurement was repeated a few hours later. In the primary measurement, quite high count rates were found. However, these countrates were gone in the second measurement. These observations have led to a few research questions that will be treated in this short paper;
- What is the origin of the high count rates measured inside the boreholes and the winch system;
- Would it be possible to separate the contribution from radon and its decay products to the gamma spectra from contributions from uranium?
- Is the activity found inside the boreholes coming from radon present inside the boreholes or from uranium in the matrix surrounding the holes?
- Where could the radon be coming from? In the following paragraphs we will show that indeed radon is caused the majority of the activity found, and that is could be coming from several tens to hundreds of meters away from the borehole locations. Before discussing the datasets obtained from XXX, we will describe in some detail where the peaks and structures seen in the gammaspectra are coming from, and how they can be used to obtain answers to the research questions posed above.
The origin of radon
Radon (222Rn) originates in the decay of radium (226Ra, half live 1600 y) that is present in all uranium bearing soils. The 226Ra is either trapped inside soil and rock particles or dissolved in the soil water phase after leaching from the soil particles. After decay of 226Ra the radon atom obtains some recoil energy that may allow the atom to escape (emanate) from the soil particle. Only radon atoms that result from decaying radium atoms close to the surface of the soil particle may emanate to the soil pore space. Typically, the fraction of radon atoms that reaches the soil poresi is between (0.01 and 0.4). The radon emanation factor for uranium ore samples is reported as 0.3ii. In the soil pores radon partitions between the water and the air phase, also a fraction will be adsorbed on the surface of the soil particles. The ratio of radon concentrations in the air and water phase is described by a Henry’s type of law. The ratio is slightly dependent on temperatureiii. Migration of radon through soils is a multiphase (water, air and possibly adsorbed to soil surfaces) phenomenoniv driven by pressure (advection) and concentration (diffusion) differences and/or buoyancy forces leading to geogas (N2 CO, CO2, Rn) bubblesv that ascend through to water phase. The half live of radon is 3.8 days. This limits the time to transport radon between places. For diffusive transport in dry soil, transport lengths are typically 1-2 m. For moist soils these lengths are in the order of 10’s of cmvi. Advection is driven by air pressure differences induced by atmospheric influences which are under normal conditions in the order of a few Pavii. This leads to soil gas velocities calculated on basis of Darcy’ law with soil permeability’s of 10-12 (clay) and 10-10 (sand) of 0.04 to 4 m per day. Upward movement of bubbles of geogas that may contain radon is the only mechanismviii that is rapid enough to explain radon transported over distances of more than 100 m.
Radon transport mechanisms
In case of a borehole transport of radon from the uranium ore body towards the borehole can in principle be driven by all three mechanisms. If the uranium ore is in close vicinity (a few meters) of the borehole diffusion and advection may contribute. In other situations transport via geogas bubbles might play a role. However it should be realized that the movement of geogas is upwardly directed and this will also limit the radial distances from the ore body to the borehole. In conclusion, for normal borehole conditions in which most likely the borehole is filled with water and of the formation surrounding the borehole the pore space is water saturated only radon from the very near environment will reach the borehole. Under these normal conditions the radon concentration in the borehole water will be somewhat lower (due to dilution) than the radon concentration in the water present in the adjacent pore space. A slight concentration gradient extending a few meters in radial direction will be established under steady state conditions. This implies that radon transport towards the borehole from an ore body at a few 10’s of meter distance is not likely to influence the signal measured with a gamma detector lowered in the borehole. The signal of the detector will reflect the radiometric properties of the formation within a 1 m radius. In situations in which preferential path ways for geogas bubble transport exist from the ore body towards the borehole elevated radon levels may occur at certain positions in the borehole. This may lead to erroneous interpretation of the gammalog. The assessment of the uranium concentration will be too high. Leaching of radium from the uranium ore body is another possibility for explaining anomalous high uranium concentration from down-hole gamma measurements. Radium is easier removed from uranium ore than uranium itself. Under salty conditions a few percent of the radium may be leached from the oreix. If part of the leached radium migrates (diffusion, water movement) towards locations close to the borehole, gamma logs will be influenced. As the half life of radium is relatively large the speed of the transport is less of an issue as was the case for radon.
Possibilities to detect radium/radon in a borehole
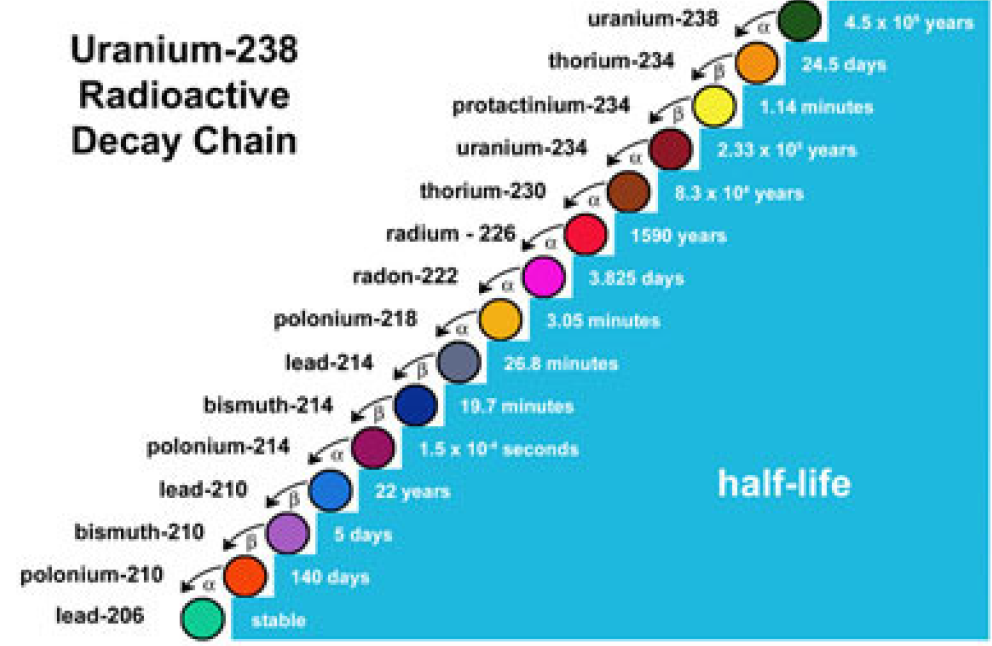
Figure 1. Uranium decay chain. Soruce: (http://www.ocrwm.doe.gov/curriculum/unit2/lesson2reading.shtml).
Different gammaray energies?
In case samples are measured from a borehole where either radium has leached or radon has penetrated, the gamma spectrum will not contain all the gamma lines that would have been measured when the entire uranium series in equilibrium is present in the sample. In figure 1 we show the 238U series starting with 238U and ending at stable 206Pb. The 238U series in equilibrium emits 2.197 gammas per Bq in the range of 20 keV to 3.3 MeV. For in situ measurements the lower energy cut off is usually somewhere at 150 keV. In the range larger than 150 keV 2.08 gammas are emitted per Bq of which only 2.5 % originates from members of the 238U series above 222Rn (238U, 234Th, 234Pa, 234U, 230Th, 226Ra). Consequently, the spectrum of a sample containing only 222Rn strongly resembles a spectrum from the entire uranium series in equilibrium. For simple low resolution gamma tools the differences between both spectra will go undetected. The major difference between both spectra is the presence of the 186 keV line of 226Ra. This line contributes 1.8 % of the spectral intensity above 150 keV. An in situ measurement with a gamma detector with adequate resolution to resolve the 186 keV line might discriminate between situations of radium leaching or radon penetration. In the latter situation no strong 186 keV line is expected.
High resolution gamma spectroscopy?
Another option is to measure samples of the formation in the laboratory using high resolution gamma spectrometry. These measurements will reveal the possible disequilibrium in the 238U series. The activity of 238U can be estimated directly from a measurement using the 64 keV gamma from 234Th. 226Ra activity can be estimated from gamma lines from radon decay period using sealed radon tight sample containers and waiting a period of at least 3 weeks between sealing and measurements to allow the sub series from 226Ra to attain secular equilibrium.
Geometrical differences?
A third possibility worth investigating to see if the uranium signal can be separated from the radon signal in borehole measurements, is found in the geometrical difference between the radon “source”, and the uranium “source” seen by a borehole logging tool. If the radon is accumulated in the borehole fluid, one would obtain a gammaspectrum that is much less influenced by absorption, than a spectrum coming from uranium located inside the matrix surrounding the detector. This effect can actually only be seen when using full spectrum analysis methods to estimate the radon and/or uranium concentrations.
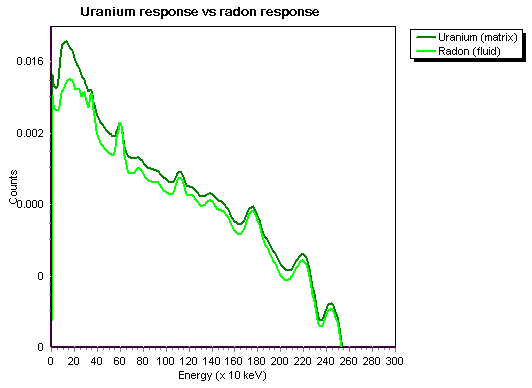
Figure 2. Spectral response curves of a 1x2 inch NaI detector. In dark green: response to a 1 ppm source of 238U inside a semi-infinite matrix surrounding the detector; in light green: response to a 1ppm source of radon in a volume of 10cm diameter and 30cm length surrounding a 1x2 inch NaI detector.
Figure 2 plots the response curves of a 1x2 inch NaI detector in a borehole geometry. The darker curve shows the response to a uranium source contained inside the matrix surrounding the detector. The lighter curve shows the response of the same detector inside a 10cmx30cm volume1 of borehole fluid containing radon. It is evident that the curves are different, despite the fact that the energies of the emitted radiation are virtually the same in both cases. The difference, most obvious at the lowest energies, arises solely from the different geometries both “sources” have. The radon source is located close to the detector, whereas the average distance radiation travels through the matrix surrounding the borehole, before entering the detector material, is several tens of cm. The absorption is in these cases completely different; low energy lines that can be seen in the largely undisturbed radon spectrum (light green) are filtered out in the matrix induced uranium spectrum.
1 We assumed the boreholes under study to have a diameter of about 10cm.
Summary
The discussion above can be summarized into a few statements that can be acknowledged or falsified by the data taken inside the boreholes:
• The field observation or rapidly decaying activity of the winch after pull up of the borehole probe can be explained by radon present in the borehole fluid. A spectral measurement could confirm this;
• Radon or radium present in the matrix surrounding the borehole cannot be distinguished from uranium using the borehole spectral data; but it can using high resolution spectral analyses of samples;
• Radon solely present in the borehole fluid can be distinguished from the uranium in the matrix because of the different spectral response curves caused by these “sources".
Borehole data
A number of borehole logs were investigated to resolve the issues mentioned before. The borehole spectra were fitted using a full spectrum analysis (FSA) algorithm taking into account virtually the complete gamma spectrum. In FSA, a set of response curves are fitted to the spectral data, yielding nuclide concentrations in ppm or Bq/kg. Two sets of response curves were used; one containing 40K, 238U and 232Th curves constructed for a 1x2 inch NaI borehole logger surrounded by a 2.6 density matrix; and one having a radon curve added. The latter curve has been constructed assuming a radon “source” inside a 10x30cm volume surrounding the detector (i.e. radon-containing borehole fluid). The figures below show a very interesting examples of the results obtained from one of the datasets provided (borehole XXX _02, downwards measurement):
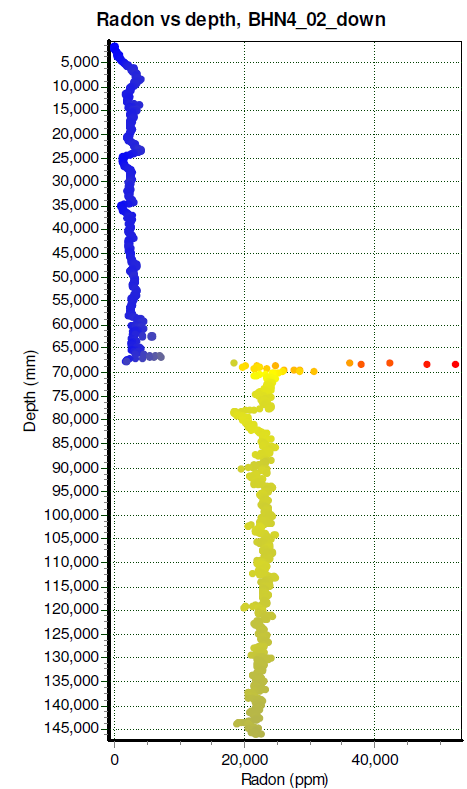
Figure 3. Depth profile of the radon concentration found in the borehole. A very drastic step in the concentration is found at a depth of 68m.
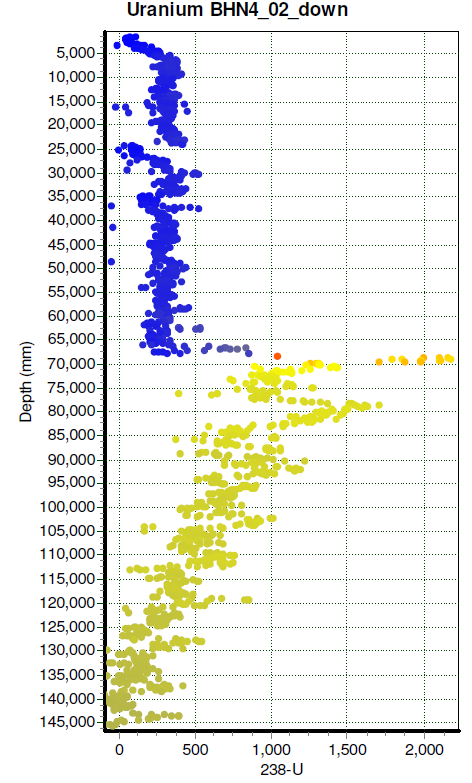
Figure 4. Same as previous, now the 238U content is displayed
Figures 3 and 4 show the profile of radon and 238U respectively, as found in borehole XXX_2. The measurement was done while moving the sensor downwards. At D=68m, a drastic increase in the count rate is observed (actually going from about 2700 cps to more than 19000 cps in just 50cm). This is a typical example of a radon leak. In figure 3, the radon concentration indeed reflects the drastic increase. The same step, but much less pronounced, is found in the 238U profile of figure 4. One should consider, however, that the response curves of radon and 238U are quite alike leading to cross correlation in the fitting procedure. Further down the borehole, the radon concentration remains more or less constant. This probably implies the radon containing water is dragged and mixed by the sensor´s movement down the hole. The actual spectra closely before and just after the radon leak are shown in the two figures below. In spectrum 666, it is clear that the majority of the signal is coming from the 238U (green line fitting the black dots). The radon line (brown) is about a factor of 10 lower in intensity. However, at spectrum 670, the situation is completely reversed: radon dominates the picture and its concentration is likely to be a factor of 10 larger than the 238U concentration.
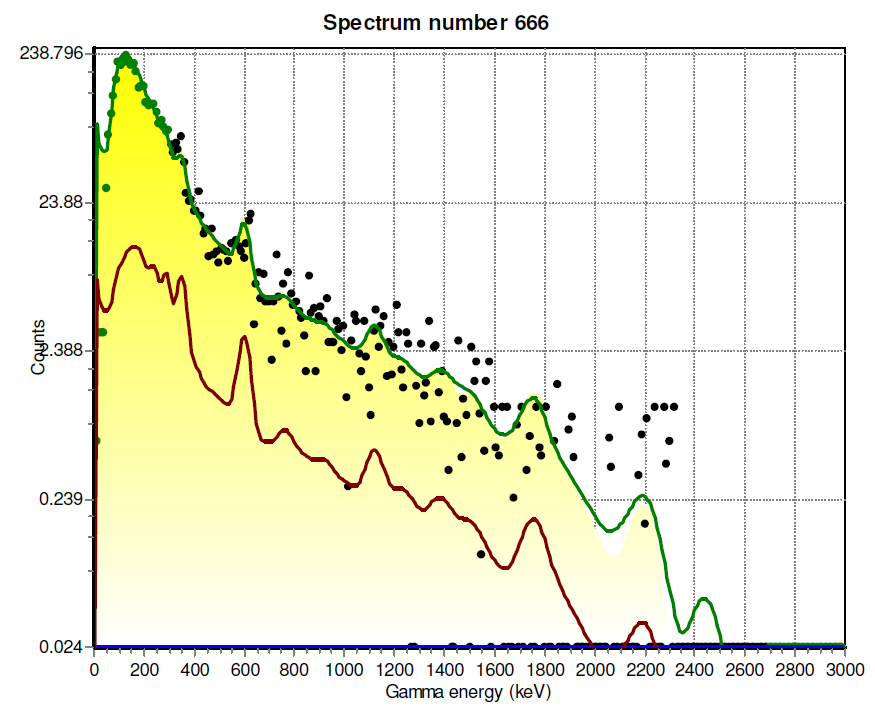
Figure 5. Gamma spectrum taken at a depth of 68036 mm. Curves: 40K (red), 232Th (blue), 238U (green) and radon (brown)
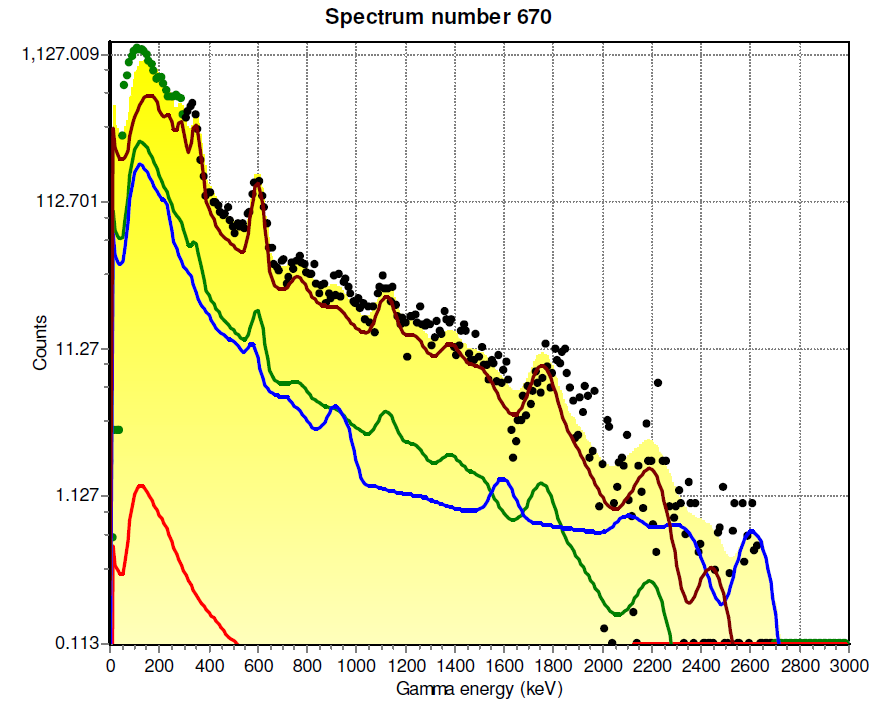
Figure 6. Gamma spectrum taken at 68436mm depth. Curves defined as in the previous figure.
Conclusions
The conclusion is clear: the elevated uranium signal found in the boreholes under study is coming from radon dissolved in the borehole fluid. In borehole BHN4_2, a very sharp point is observed at which the 222Rn concentration is “blowing up” by a factor of 10 or more. At this position in the borehole, apparently there is a radon feed possibly originating from radon in geogas. If the radon would come stem from other, much slower transport processes, it would not have been possible to separate its signal from the 238U signal from the matrix. So, we conclude that the radon is likely to originate from geogasses from deeper layers below the boreholes.