
On accuracy and spatial resolution
In most applications for mapping with a gamma-ray spectrometer, measurements are made along parallel lines. With the ability of the sensors to map at a high frequency of 1Hz, the data density along these lines can be large. As a result, the distance between the datapoints along the line is much smaller than the distance between datapoints between lines. Depending on the method of interpolation, this can result in maps showing linear features along the measured lines that are not real, but are an artefact of the high-resolution data and method of data analysis.
Effect of line spacing
In a typical example for land-borne mapping, the line spacing between survey lines can be 12 m, whilst the distance between the points on this line are 1 m apart. This gives a 12 times higher spatial resolution along the line than between the line. This difference in resolution is of great importance in a situation where you expect a strong variation in soil properties in the direction of the lines but where the soil properties do not change much in the direction between the lines. This does not give added value and can also result in unwanted effects where linear features along the measured lines occur that are not real.
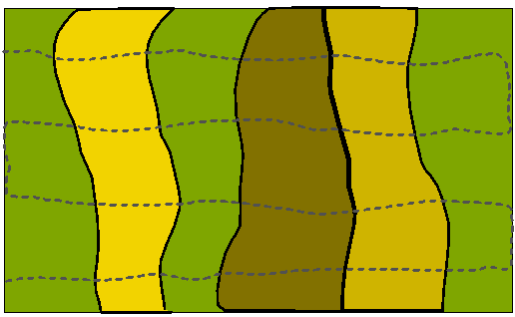
extreme example of a map showing variation in soil properties (denoted by colours) perpendicular to the survey lines, sampled with high resolution. The high-resolution data has added value: this helps to delineate the different varying soil properties.
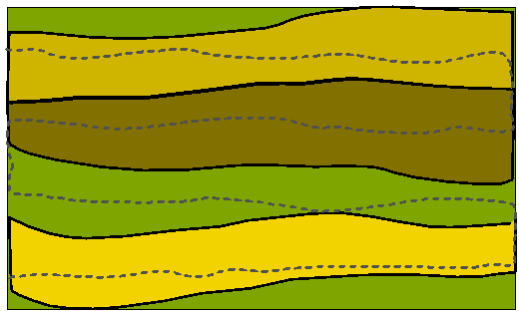
extreme example of a map showing variation in soil properties (denoted by colours) parallel to the survey lines, sampled with high resolution. The high-resolution data no added value: this does not help to delineate the different varying soil properties.

extreme example of a map showing variation in soil properties (denoted by colours) perpendicular to the survey lines, sampled with low resolution. The resulting map will not differ from the high-resolution map, but the low-resolution data has added value: this reduces computing speed and data handling.
The accuracy of spectral gamma measurements
A gamma-ray spectrometer is a passive system and measures the total amount of high energetic photons emitted from its surroundings. If you measure a little amount of photons, the accuracy for that point measurement will be lower than if you measure a large number of photons. There are different ways of increasing the accuracy of the measurements but this can basically be divided in two approaches:
- Getting more photons in the detector
- Using more photons in the data processing
Getting more photons in the detector
The total measured number of photons in the detector can be improved by increasing the size of the detector, bringing the detector closer to the source (e.g. flying lower in airborne surveys), using a different type of detector material (see: Choice of detectors) or counting for a longer period of time (reducing the sample frequency).
If you count for a longer period of time, you will lose spatial accuracy (since you have less sample points) but you will increase the accuracy per sample point. In fact each time a sensor is deployed one should consider the trade-off between the required accuracy per point and the spatial accuracy needed. For ground-borne surveys a typical acquisition frequency is 0.2-1 Hz.
Using more photons in the data processing
Increasing the number of photons in the processing of spectral gamma data is an important aspect of the full-spectrum data analysis (FSA) that is part of the software package GAMMAN (Full spectrum analysis Hendriks&Limburg.pdf). Another feature in GAMMAN adds individual spectra and thereby increases the number of counts for each measurement.
- The feature Fit Each fits each spectrum without merging different spectra.
- The feature Running Average smoothens the data by keeping each sample point, but by summing the spectra of adjacent sample points. This keeps all sample points, but increases the accuracy per sample point. A drawback of this method is that data is smoothed along the survey line and not by omnidirectional interpolation. It thereby introduces anisotropy in the data.
- The feature Repeated Average merges sample points, thereby reducing the number of sample points and increasing the accuracy for each point. The point are merged in the direction of the survey line and, especially when the survey is conducted in a grid with crossing lines, the merging should not be larger than the distance between the survey lines.
Effects of the methods of data processing on the map
Increasing the accuracy per data point will decrease the spatial accuracy of the data. These trade-offs can be overcome by using interpolation methods as kriging. In the process of Kriging, a variogram is made. This variogram determines the accuracy for each datapoint (which should be equal to the accuracy numbers reported in GAMMAN and that are determined in the fitting of the full spectrum). Kriging uses this accuracy per datapoint and the spatial dependence between the properties of interest to make a grid. However, Kriging is a time consuming process and not all software packages have included an easy to use Kriging algorithm that includes the variogram (the mapping software Surfer from Golden Software includes a powerfull Kriging toolpackage). Therefore, many people use inverse distance (IDW) interpolation for generating maps. Since IDW mostly accounts for spatial dependence and only uses a general smoothing parameter, the data processing in GAMMAN can have an effect on the resulting grids.
Description of data
We used a demo dataset from a cropfield with a size of 300x400 m that was mapped with a line distance of 12 m. The a sampling frequency was 1 Hz, driving at 3.6 km/h. This results in a distance between points of 1 m.
The dataset was analyzed with the 3 methods. In this analysis, the averaging was based on an extremely large sample of 15 datapoints. This will exaggerate the effect. Normally, a running average of 15 samples will not be used, but the averaging will be executed over a smaller number of samples.
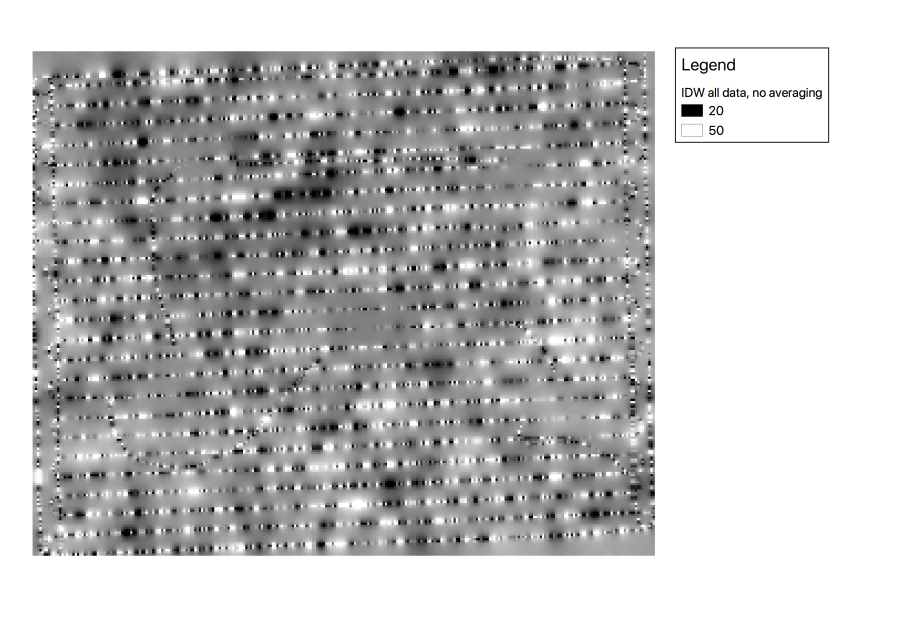
Fit each
The results of the fit each method show all data points, but the results have a "noisy" character. The simple IDW map shows many extreme (high and low) values and a spatial smoothing filter should be applied to filter the noise. 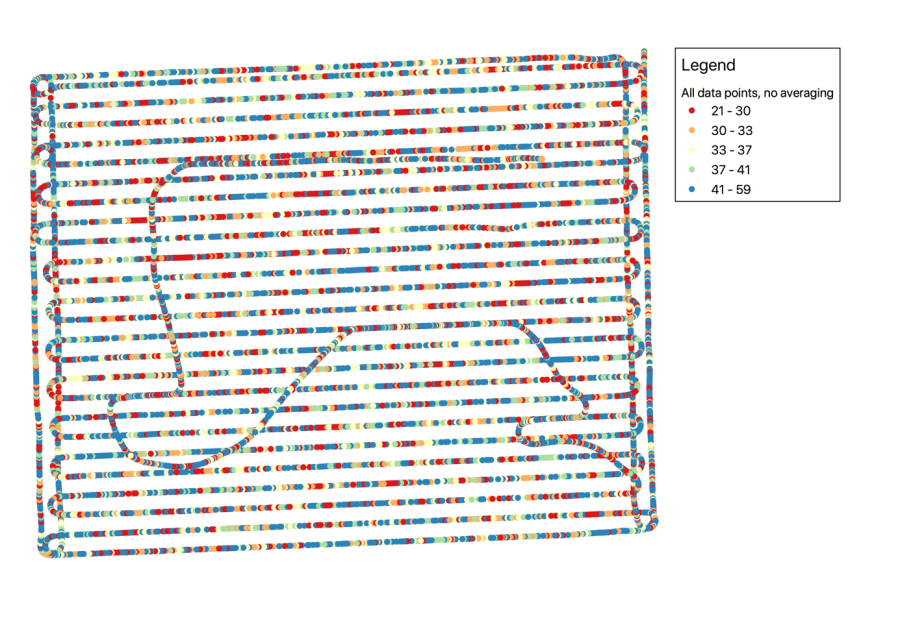
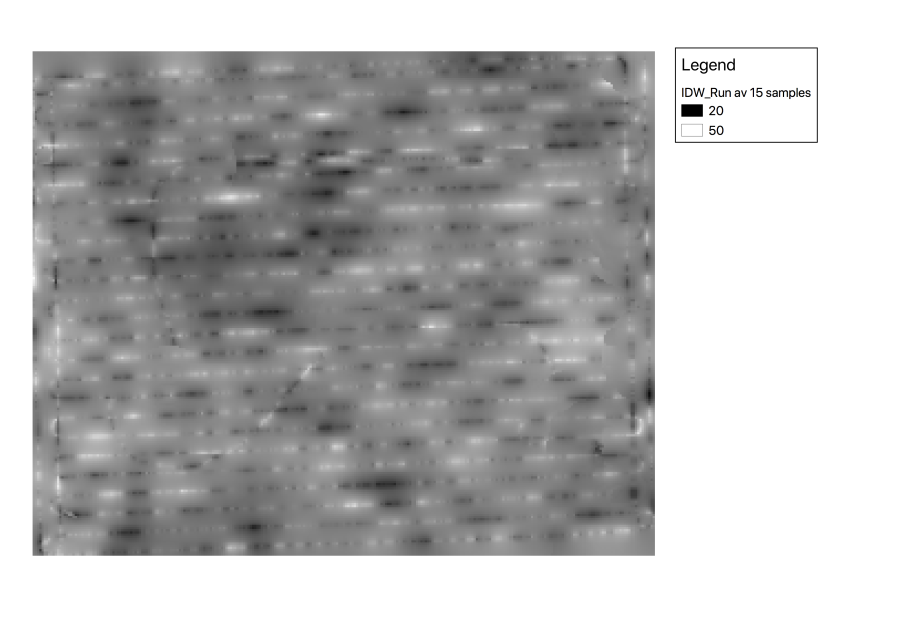
Running Average
The running average method results in data that shows high and low zones along the lines. In the interpolation of the data this anisotropy is clearly visible as line structures.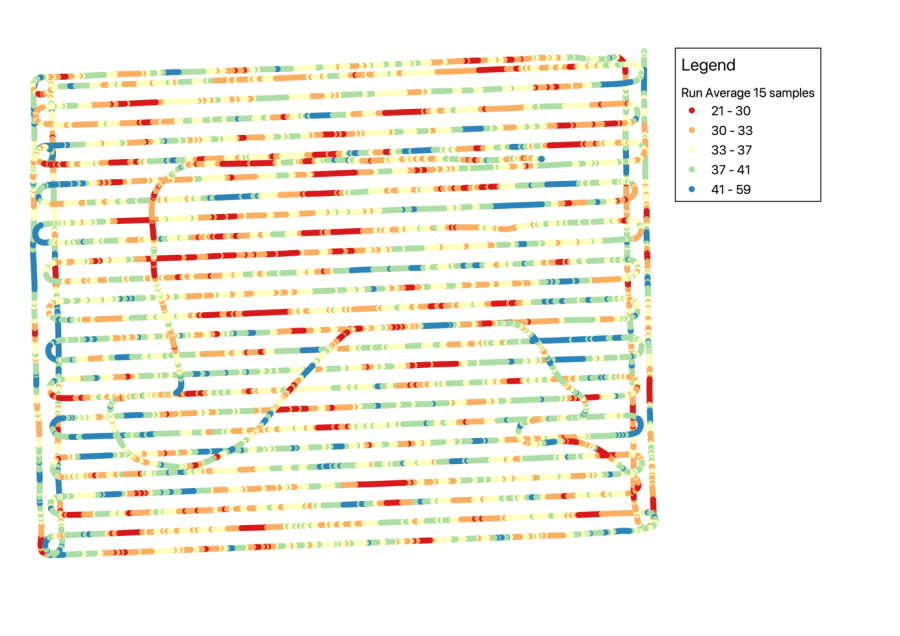
Repeated Average
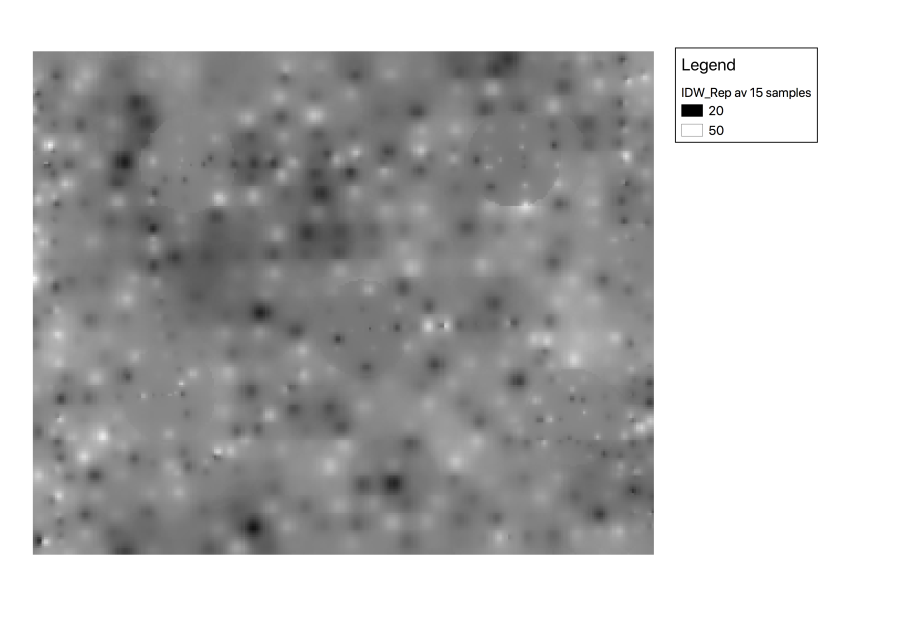
After the repeated average analysis, the dataset contains less datapoints, but the datapoints are not aligned along a line, but show a more evenly (random) spaced distribution.
Each sample point has a high accuracy and this is reflected in the interpolated map: highs and lows are shown as "bullets" in the grid, but this distribution is omnidirectional and does not show oversampling along a line. 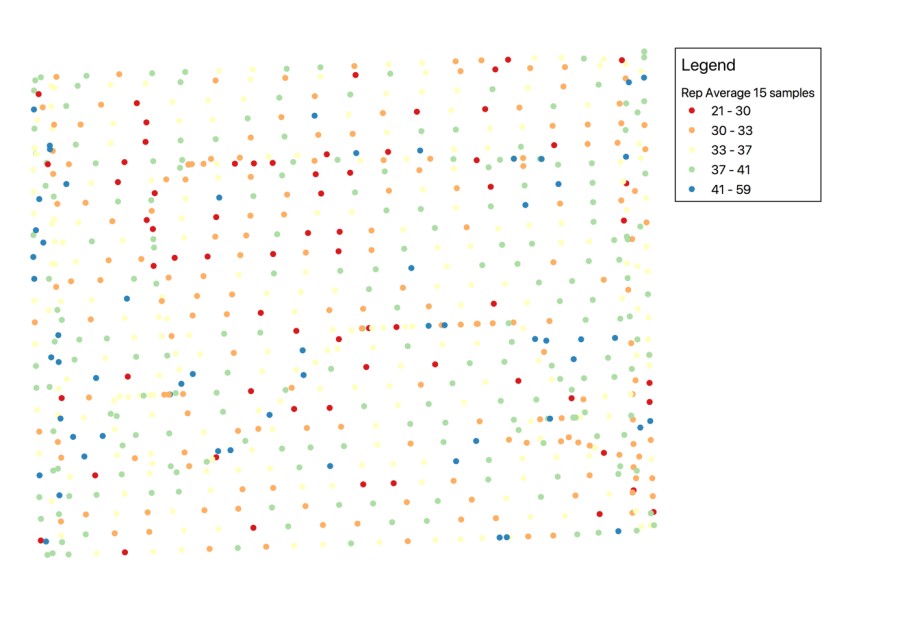
Conclusions
Clients often ask to map at a high spatial resolution with a high accuracy per data point. It is therefore tempting to map at a high sampling interval and use methods as a running average to improve on accuracy. However, depending on the width between the survey lines, this can have an effect on the resulting maps. Due to the oversampling along the line, strange line-shaped features might occur that are the result of the method of data processing.
To generate accurate maps with high-spatial resolution, we recommend to use:
- the feature repeated average to reduce the number of datapoints used in the interpolation algorithm. If the survey was conducted along lines, the resulting points should be in an even grid of datapoints. This dataset can be interpolated using normal interpolation methods
- the feature analyse all, resulting in a large number of datapoints with low(er) accuracy. When properly using kriging and making use of the nugget value in the variogram, identical results as (a) will be shown.