
Mapping Sediment Contamination with a Gamma-Ray Spectrometer, Underwater and on Land
1. Summary
Environmental contamination due to human activity is recognized as one of the modern dangers of our industrial advancements. The current approach to the management and monitoring of contaminated aquatic and non-aquatic sediments involves invasive, often labor-intensive methods. The method is time-consuming and costly and the resulting contours of the contaminant distribution are subject to a number of potential errors, with the potential for ‘hot spots’ to remain unmapped.
At present, there are no means for the passive, in-situ mapping of contaminants in aquatic and non-aquatic sediments. Our method addresses the main problems associated with the current approach. We propose a method that provide rapid, spatially detailed data on contaminant distributions and concentrations in sediments by using a gamma-ray spectrometer. A gamma-ray spectrometer can be used for mapping aquatic sediments (by using a vessel as platform) and non-aquatic sediments as floodplains by using a quad-bike or drone as platform for mapping. The study shows how these gamma-ray spectrometers have been used to map the contamination of a river basin of the Elbe tributary in Germany. The combination of all platforms result in information on contaminant levels of a river system in aquatic and non-aquatic sediments
2. Introduction
Environmental contamination due to human activity is recognized as one of the modern dangers of our industrial advancements. Historic releases at current and former industries have resulted in source to environmental receptors. Contaminants of Concern include organic contaminants and heavy metals. Environmental restoration and closure of contaminated sediment sites is a priority, since the contaminants can enter in the foodchain by uptake in biota and the sedimentary basins can act as a new source by remobilization of particles in flood events.
The current approach to the management and monitoring of contaminated aquatic and non-aquatic sediments involves invasive, often labor-intensive, methods. Particularly in the collection of sediment samples to quantify and map the distribution of contaminants. The method is time-consuming and costly, with the requirement that sediments collected in the field require storage, transportation, and laboratory analysis. The contours of the contaminant distribution based on the samples are subject to a number of potential errors dependent on sample size and inter-sample spacing, with the potential for ‘hot spots’ to remain unmapped.
At present, there are no means for the passive, in-situ mapping of contaminants in aquatic and nonaquatic sediments. As a result, a proper risk assessment of sediment contaminant levels is often overtly expensive or lacks proper data. Our method addresses the main problems associated with the current approach. We propose a method that provide rapid, spatially detailed data on contaminant distributions and concentrations in sediments by using a gamma-ray spectrometer. A gamma-ray spectrometer can be used for mapping aquatic sediments (by using a vessel as platform) and non-aquatic sediments as floodplains by using a quadbike or drone as platform for the sensors.
3. Mapping contaminants with a gamma-ray spectrometer
Many contaminants are adsorbed to clay particles in aquatic sediments. As a result, contaminant levels are strongly correlated to the composition of these sediments. In various applications, concentrations of natural occurring radionuclides are used as a proxy to map composition of soil and sediment (van Egmond, 2018; Wijngaarden, 2002) for mapping sediment transport in rivers and seas, or for mapping soil texture for agriculture.
In our approach for mapping contaminants in sediments, measured concentrations of radionuclides serve as a proxy for sediment contaminants. The gamma-ray spectrometer provides a direct measurement of these concentrations of radionuclides. Most common are the concentrations of naturally occurring radionuclides (40K, 238U and 232Th) or other man-made radionuclides (or fission products) such as 137Cs.
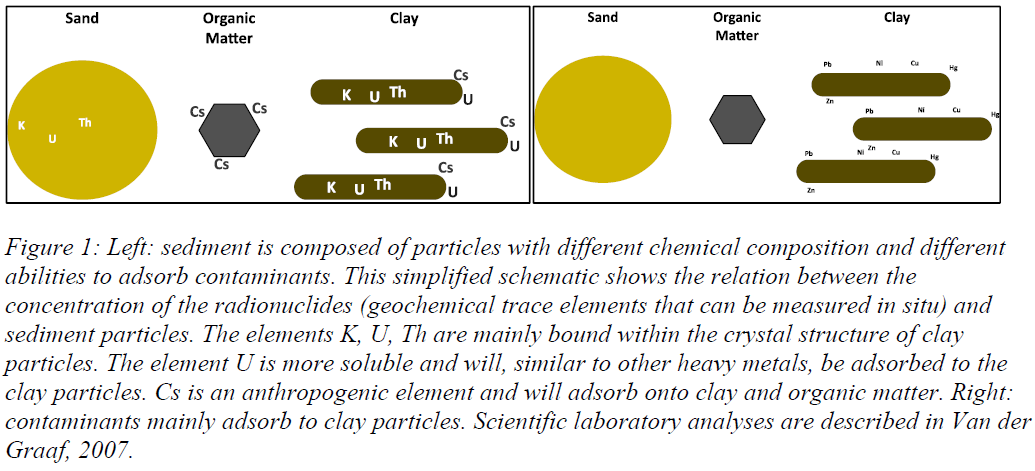
Research (van der Graaf et al., 2007; Förstner et al., 2016; Jacobs et al., 2015) has established that radionuclides are excellent proxies for sediment contaminant concentrations via locally established correlations. The rationale behind the approach is illustrated below (Figure 1). In summary, the fine sediment particles such as clay and organic matter contain increased concentrations of radionuclides. It is known that contaminants such as heavy metals and organic pollutants, when released into the natural aquatic environment, will bind to fine sediment particles (Perk, 2006). How the contaminants bind to the sediment particles depends upon the properties of the sediment (e.g. type of clay), properties of the chemical constituents and the concentrations of the chemical constituents. Therefore, a calibration model has to be determined for each site in which one of these properties differs.
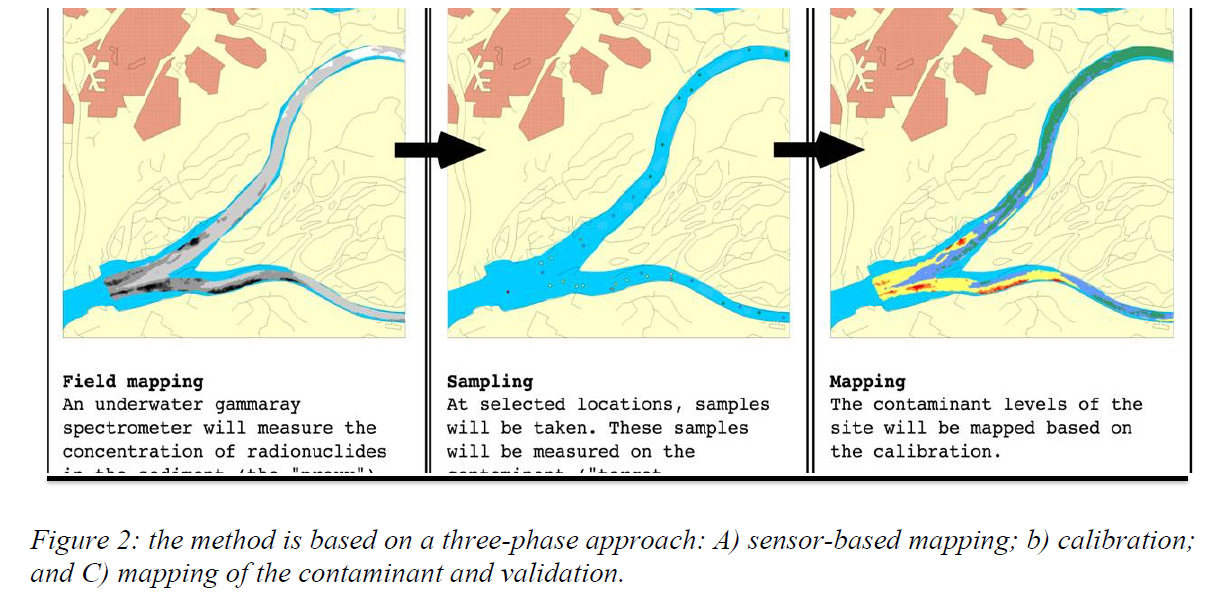
Calibration samples are collected after a gamma-ray spectrometer survey. For the sampling, the initial variation of the sediment (left map of fig 2) is determined and sample locations are selected based on this variation. The samples are split into two parts: contaminant concentration is measured on one part, radionuclide concentration on the other part. Based on these measurements, a site-specific application model of the relationship between the proxy and the contaminant of interest is established.
4. Field Approach
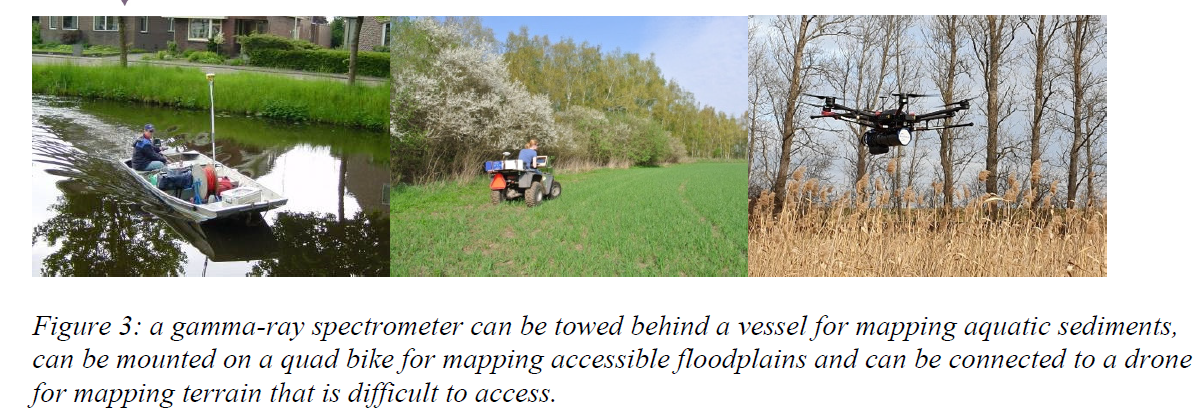
Mapping radionuclides is common practice in prospecting for mining exploration purposes. These spectrometer systems are often large, bulky and used in planes for regional mapping. Recent technological developments resulted in smaller gamma-ray spectrometers that can be used from smaller platforms, for land-borne and underwater surveys (figure 3). These surveys can be conducted on a local scale in river sections with a size of several hundreds of meters up to tens of kilometres.
5. Case study: the Elbe basin, Germany
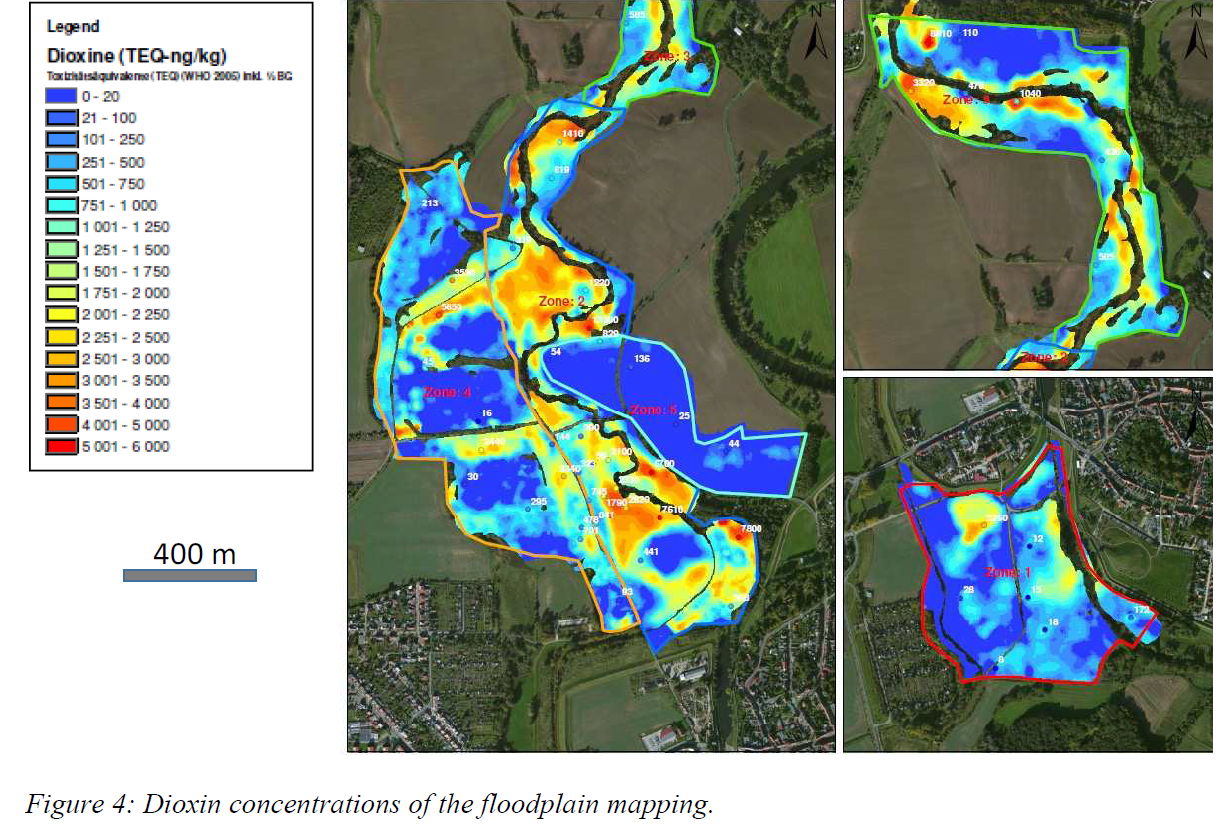
The Elbe River is one of the major rivers of Central Europe. It rises in the northern Czech Republic, traverses eastern and northern Germany before flowing into the North Sea northwest of Hamburg. Since the early 1990s the Spittelwasser creek has been in the focus of public and political awareness and the subject of numerous investigations dealing with the contamination of water, sediment, and soil in the Elbe river basin. For many decades, waste water from the chemical industry located at the Bitterfeld-Wolfen site was discharged into the Spittelwasser creek and Mulde tributary. Large areas of the floodplains of this basin were used as stacking basins for the heavily contaminated waste water during flood events, when the waste water discharge into the underlying water bodies was constrained. As a result, large amounts of contaminants have been released into the river systems and were buffered in the aquatic sediments in the rivers and creeks and in the non-aquatic sediments on the floodplains. In this period, mostly organic chemicals were released from the site and the increased levels of polychlorinated dibenzodioxins and furans (PCDD/F), hexachlorocyclohexane (HCH), and organotin compounds, have still and important effect on surface water quality of the river still today.
To assess the contamination levels of the sediments on the floodplains and sediments in the river, a combined investigation was conducted. Underwater mapping (with and MS-1200 sub) was conducted in the river; quad-borne mapping (with and MS-2000) was conducted on the floodplain that were easy to access; drone-borne mapping (with and MS-1000) was conducted in the areas that had difficult accessibility. For all surveys, gamma-ray spectrometers of Medusa Radiometrics were used. With this approach, large areas (>300 ha) were mapped at a spatial resolution of 10 x10 m. The results of these mappings are integral maps of contaminant levels of the sediments (figure 4). With this data, government has detailed information of the contamination on a river-basin scale. This helps to define proper remediation measures.
6. Conclusions
A gamma-ray spectrometer is a versatile geophysical tool and has many applications in soil science and environmental studies. These sensors can be applied from different platforms, ranging from underwater use, quad bike mapping and drone-borne surveys. Combining these approaches result in information on contaminant levels of a river system of aquatic and non-aquatic sediments.
7. Acknowledgements
The measurements were conducted for Landesanstalt für Altlastenfreistellung (LAF) of Sachsen Anhalt, Germany. Part of the research has been co-funded by the European Fund for Regional Development (EFRO).
References
Förstner, U., Hollert, H., Brinkmann, M., Eichbaum, K., Weber, R., Salomons, W., 2016. Dioxin in the Elbe river basin: policy and science under the water framework directive 2000--2015 and toward 2021. Environmental Sciences Europe 28, 9. doi:10.1186/s12302-016-0075-8
Jacobs, P., Schaffranka, E., Zauter, H., 2015. Organic contaminants in suspended particles, sediments, and floodplains of the Spittelwasser creek and the Mulde river with regard to their relevance in the Elbe river basin. Hydrologie und Wasserbewirtschaftung 59, 342–353.
van der Graaf, E.R., Koomans, R.L., Limburg, J., de Vries, K., 2007. In situ radiometric mapping as a proxy of sediment contamination: Assessment of the underlying geochemical and physical principles. Applied Radiation and Isotopes. doi:10.1016/j.apradiso.2006.11.004
Egmond, F.M. Van, Veeke, S. Van Der, Knotters, M., Koomans, R.L., Limburg, J., 2018. Mapping soil texture with a gamma-ray spectrometer: comparison between UAV and proximal measurements and traditional sampling. WOt-technical Rep. 137, 58p
Wijngaarden, M. Van, Venema, L.B., Meijer, R.J. De, Zwolsman, J.J.G., 2002. Radiometric sand – mud characterisation in the Rhine – Meuse estuary Part A . Fingerprinting. Geomorphology 43, 87– 101.
Perk, M. van der, 2006. Soil and Water Contamination From Molecular to Catchment Scale, 1st ed. Taylor &Amp; Francis Ltd.