
Ecological assessment and sediment mapping
This paper was presented the EAGE Near surface geophysics conference 2016
Introduction
In recent years, laws ands regulations in the field of ecology became more strict due to public pressure. Therefore, the discharge of fines during dredging and land reclamation works and its impact on seafloor habitats is an important aspect in environmental impact assessments.
The potential effects of sediment plumes on the seafloor sediments can only be understood when the total release of fine sediments by human re-allocation of fines can be related to the natural variation in concentrations of fines in seafloor sediments. Up until now, the buffering capacity of the seafloor for fine sediments has been estimated, but has hardly been measured. We describe an approach in which an underwater gamma spectrometer can be used to quantitatively map the concentration of fines in sediments. With this approach, the natural variation of fines and thereby the buffering capacity of the seafloor can be monitored. The natural dynamics due to re-suspension and large-scale sediment transport patterns can be quantified.
An underwater gamma spectrometer for mapping sediments
Traditionally, the content of fines in seafloor sediments is determined by taking sediment samples by for example (box)coring. These measurements give accurate information of one spot, but spatial variation in the concentration of fines, e.g. due to the presence of small-scale morphological features such as ripple structures, can result in data that is not representative for large areas. Spatial variation can be mapped by taking large amounts of sediment samples, which is often too expensive.
Different hydrographic methods exist to map the variation in the composition of the sediments on the seafloor. Analysis of the acoustic signals of multi-beam and single-beam echosounders or side-scan sonar, gives high-resolution images of the composition of the sediments. This information helps to zone the seafloor into classes with one type of acoustic reflection that can be related to a certain type of sediment. In some cases also the variation in median grain size can be determined (Snellen et al., 2013). However, it is not possible to determine absolute concentrations of fines or absolute values of grain sizes of the sediment bed (Du Four et al., 2005).
We learned that the concentration of natural occurring radionuclides correlates strongly to the concentration of fine material (clay) in sediment. These radionuclides (40K, 232Th and 238U) are present in rocks and sediments since the origin of the earth. Most sediments are composed of sand, clay and organic matter. Due to the differences in chemical composition of these minerals, the concentration of radionuclides varies for each fraction (van der Graaf et al., 2007; Wijngaarden et al., 2002). This relation between the concentration of radionuclides and sediments is established by calibration in the laboratory (Figure 1).
The concentration of radionuclides can be measured in the field by a seaborne gamma spectrometer. This sensor can be towed over the seafloor behind a vessel. Each second, the system measures concentrations of the natural occurring radionuclides of the seafloor. For the measurements described, a MS-700 SUB (Medusa Sensing) was used. The system comprises a 6x3 inch CsI-based scintillation detector connected to a tailor-made spectrum processing unit. This unit comprises a HV supply for the detector, 512-channel multichannel-analyser and sensors to read sediment roughness and water depth. The torpedo-shaped housing is tested up to 600m water depth and is connected to the vessel by a Kevlar-strengthened power/data cable. This system was successfully used to measure variation of grain size in the field (Snellen et al., 2013), to measure the sediment transport of tracer material (Nederbracht and Koomans, 2005) and to map the concentration of silts in sediments (Venema and de Meijer, 2001).
The advantage of the proposed system over traditional sediment sampling, is that the detailed maps of sediment composition determine the spatial variation at a high resolution and is easily applicable in small and large research areas. Moreover, it is a cost effective method for monitoring purposes.
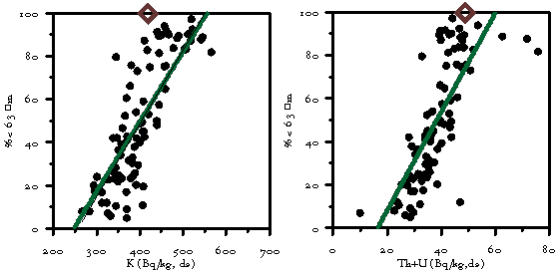
Figure 1: scatterplots of fine sediment content (%<63µm) vs potassium and the sum of the concentration of uranium and thorium of sediment samples from various projects around the North Sea. The values of the fine sediment fraction are derived from different methods for sediment analysis (Malvern, sieving). The brown datapoint is based on a sample derived from fine sediments present in the water column.
Mapping transport of fine sediments from a dumpsite
In a project for Rotterdam harbor, the Netherlands, the transport of fine material, relocated to several gravel pits, was monitored and quantified with a gamma spectrometer and with a multibeam. To this purpose, two surveys have been conducted: one survey prior to disposal and one survey after two years of disposal. An area of 10 x 9 km2 was monitored. The entire survey was carried out in four days and comprises about 120.000 data points.
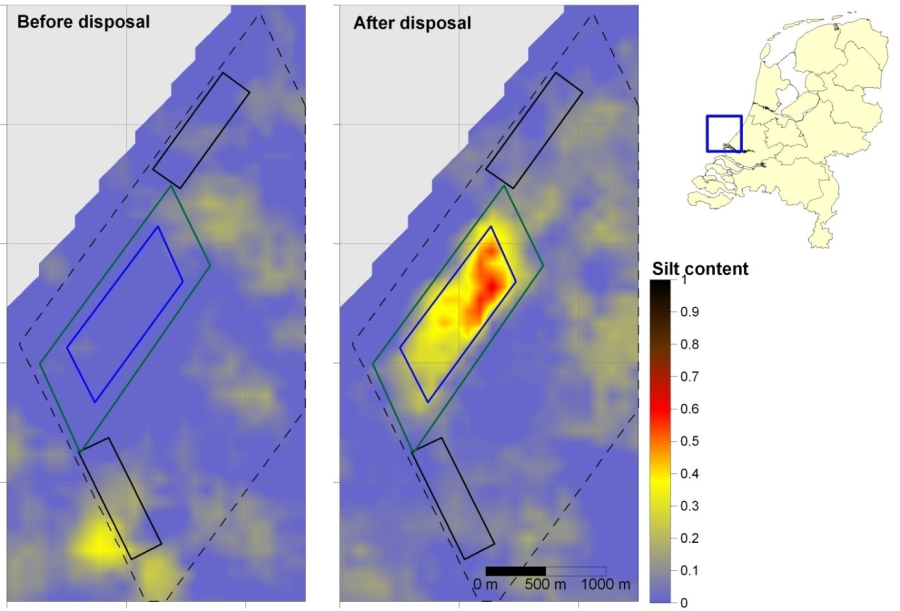
Figure 2: Comparison of silt fraction (ranging from 0 to 1) of total sediment of the seafloor, before and after disposal.
Figure 2 shows the distribution of fine sediments in the area around the former gravel pits (blue rectangle). At t0 the disposal site does not contain any fine sediments. The concentrates of fine sediments in the other parts of the area originate from a former disposal site (Venema and de Meijer, 2001). At t1 the new disposal of the harbor silts can clearly be noticed by the increased silt concentration in the gravel pit. The dispersal from the gravel pit is small; the sludge extends only 250 m around the sides of the pit.
This data was used to quantify the dispersal of the fines from the dumping site. This mass balance has been used to validate the results of model calculations. The quantitative information on the transport of sediment helps to refine models for an improved assessment of the effectiveness of a depot of fine sediments.
Monitoring natural buffering of fines
Silts that are present in sand extraction sites, can potentially mobilize in the water column and result in an increased turbidity of the water. To estimate the consequences of this turbidity for ecology, computer models are used to predict the potential effects of this mobilization. However, in these models assumptions are made on the capacity to buffer silts in the sandy sediments. Due to sedimentary processes at sea, fine material present in the water column will settle during calm weather and will be stored in the upper decimeters of the sediment bed. During events, like a storm, these fines will go in suspension (Figure 3). The time scales involved in these processes are unknown.
To determine these time scales, the MEP program of Stichting LaMER and Rijkswaterstaat commissioned a research program. In the program, a MS-700 SUB gamma spectrometer was used to measure the change in fine sediment concentration along two lines with a length of 8 km, perpendicular to the coastline near Bergen, the Netherlands. In total, 10 campaigns were conducted in the period of September 2009-October 2012. The measurements show how the fine sediment concentration varies along the profile of the coastline and varies in time. Since the measurements cover a complete line (instead of just a few sample points), this dataset is the first one that can be used for an assessment of temporal changes in the content of fine sediments.
The change in fine sediment (silt content) was compared to the wave height prior to the measurements. This comparison shows how the measured content of fines in the sediment is lower after a higher wave height 2 days before the measurement (Figure 4).
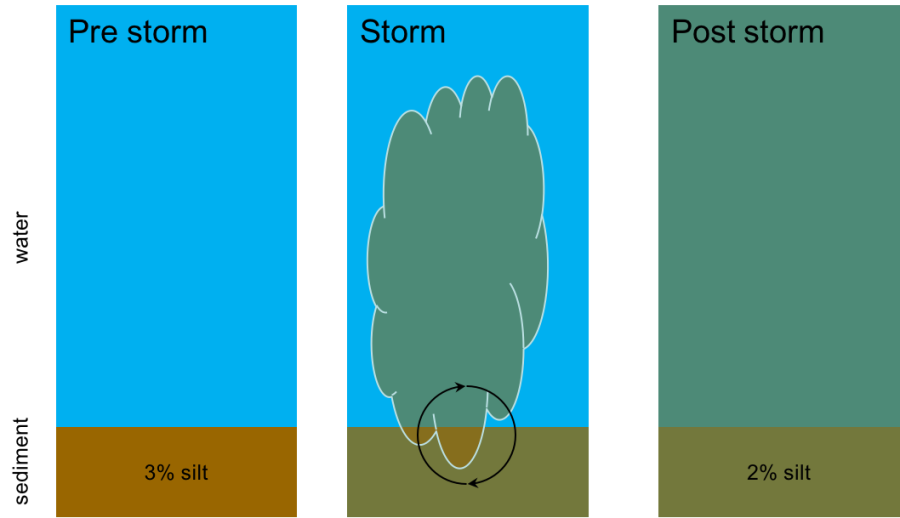
Figure 3: the process of mobilisation and buffering of fine sediments.
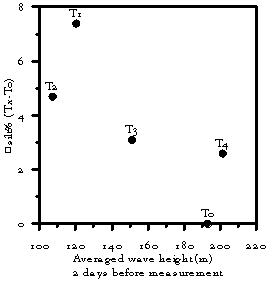
Figure 4: Change in average silt content as a function of averaged wave height before the measurement.
Conclusion
Dredging and land reclamation projects are carried out under strict regulations for ecological impact. The standard approaches for site investigations provide only information on selected points where sediment samples have been taken. We demonstrated how geophysics can be used to quantitatively assess the distribution of fine sediments on the seafloor. The measurements with an underwater gamma spectrometer show how fine sediments are dispersed from a dumpsite of dredge spoil and how fine sediments are buffered in the sediment bed and are mobilized by waves. The information derived from the geophysical measurement give the opportunity to measure the effects of human induced projects at sea.
References
Du Four, I., Deleu, S., Darras, I., Roche, M., Koomans, R., Van Lancker, V., [2005]. Comparison between different seabed classification techniques and validation with sediment samples on two shallow-water dumping sites (Belgian continental shelf)., in: Shallow Survey 2005 4th International Conference on High Resolution Surveys in Shallow Water. Plymouth, Devon, UK.
Nederbracht, G., Koomans, R.L., [2005]. Nourishment of the slope of a tidal channel: from experiment to practice., in: ASCE (Ed.), Coastal Dynamics. Barcelona, Spain.
Snellen, M., Eleftherakis, D., Amiri-Simkooei, A., Koomans, R.L., Simons, D.G., [2013]. An inter-comparison of sediment classification methods based on multi-beam echo-sounder backscatter and sediment natural radioactivity data. J. Acoust. Soc. Am. 134, 959-70. doi:10.1121/1.4812858
van der Graaf, E.R., Koomans, R.L., Limburg, J., de Vries, K., [2007]. In situ radiometric mapping as a proxy of sediment contamination: assessment of the underlying geochemical and -physical principles. Appl. Radiat. Isot. 65, 619-33. doi:10.1016/j.apradiso.2006.11.004
Venema, L.B., de Meijer, R.J., [2001]. Natural radionuclides as tracers of the dispersal of dredge spoil dumped at sea. J. Environ. Radioact. 55, 221-39.
Wijngaarden, M. Van, Venema, L.B., Meijer, R.J. De, Zwolsman, J.J.G., [2002]. Radiometric sand - mud characterisation in the Rhine - Meuse estuary Part A . Fingerprinting. Geomorphology 43, 87-101.