
Calibration of spectral gamma tools
This research was sponsored by the Dutch Ministry of Economic Affairs (SenterNovem) under the CASIMIR programme, project number CSI4004.
Calibration of spectral gamma tools, Ab initio calculations of standard spectra
Introduction
The use of gamma-ray measurements has a long-standing tradition in geophysical research. The measurement of gamma radiation emitted by naturally occurring elements like potassium (40K), thorium (232Th) and uranium (238U) finds applications in mineral exploration (de Meijer et al., 1997), environmental research (Medusa), precision farming (SoilCompany) and borehole logging (Hendriks et al., 2002).
Scintillation detectors are used for gamma-ray measurements in a wide variety of geometries In the present context, "Geometry" is defined as the spatial shape of the source-detector system and the density and material composition of the source.. Calibration of these detectors should be performed for each of these geometries. Traditionally, gamma sensors are often calibrated in a pure empirical way by placing a gamma spectrometer in a calibration facility (e.g. a borehole, calibration pads) and measuring the response of the system (see e.g.(Stromswold, 1995)). This method is only valid, if the activity concentration of the calibration facility is exactly known and if the geometry of the calibration facility exactly resembles the geometry of the location where the system is deployed.
In this section we describe a procedure in which detectors are calibrated using a combination of Monte Carlo simulations and measurements in a dedicated set-up having well-known concentrations of radionuclides. The result of this calibration procedure are sets of so-called standard spectra, defined as the response of a detector to a 1 Bq/kg source of a nuclide in a given geometry.
The results were also published in the paper Monte Carlo based calibration of scintillation detectors for lab and in situ.
Background
Records of gamma radiation are in general used to establish the concentration of radionuclides in a given sample or volume. This concentration, normally given in Becquerel A Becquerel is the SI unit for radioactive decay. A source with activity of one Becquerel (Bq) equals one decay per second, on average. per kilogram (Bq/kg) or in ppm, is known to be specific for given mineral types. Each mineral can be characterized by a radiometric fingerprint, or a concentration vector {C40K, C232Th, C238U} (de Meijer, 1998).
Regardless of the data-analysis method, a calibration of the detector response is necessary. One way to calibrate the response is using test pads for airborne and water bottom applications (Grasty et al., 1985; Minty, 1992), or test pits/drums for borehole applications, (Young, 1980). Such calibrations have limitations in the extent to which they can mimic in situ conditions. For example, the properties of the test facilities cannot easily be modified with respect to density and composition. This leads to detector responses valid for a particular combination of geometry, density and material composition which are either assumed to be valid for other conditions as well, or "translated" towards other geometries using empirically obtained scaling factors.
In addition, it is practically impossible to construct test facilities containing only one radionuclide, or without any radionuclides (Grasty et al., 1985). Consequently, the determination of calibration spectra from experimental data requires unfolding of the contributions of the constituents. However, after unfolding, the response function for one radionuclide still contains (small) contributions of the gamma-ray spectra of the other radionuclides.
All these factors limit the accurate extraction of radionuclide concentrations from in situ gamma-ray spectra.
The calibration procedure
Several of the limitations inherently connected to laboratory setups can be removed by using a combination of Monte Carlo simulations of standard spectra, and a single physical calibration setup, to test the applicability of the generated spectra.
The general idea is that using MC simulations, standard spectra can be created for a given detector inside a given calibration setup. The validity of the MC model can be tested by fitting a spectrum taken in the calibration setup with the MC-created standard spectra.
If the MC model properly describes the detector-calibration setup, then the standard spectra would perfectly match the measured spectrum.
The second step in the calibration procedure is to use the information obtained fitting the MC spectra to the test spectrum, to derive standard spectra for other (target) geometries, without having to do a calibration measurement in such a geometry! In the proceeding text we will discuss the ingredients needed to use this approach: the Stonehenge calibration facility, the MC models used to simulate detector response and the normalization and broadening of standard spectra.
Monte Carlo simulations
The MCNPX code (version 2.5.0) is used to model response of scintillation detectors to (natural) gamma radiation originating from a multitude of geometries:
The Stonehenge calibration facility (semi-infinite cube mimicking a borehole configuration);
Flat bed geometry (as seen from a plane, car or hand-held detector);
Underwater geometry (as seen by a submerged detector).
The latter two geometries are infinite in one or more dimensions and to be accessible to simulations the geometry is truncated (restricted in size). For all geometries, the maximum volume contributing to the measured signal is found by simulating the detector response to series of sources with increasing volumes. Initially, increasing source size will increase the intensity of the (simulated) spectrum. However, beyond a certain (maximum) source size, no extra intensity is found in the spectrum. In our calibration studies, the infinite geometries are truncated such that the volume considered provides 99.9% of the radiation.
Modelling of (natural) gamma radiation
Natural gamma radiation originates from 40K, from the natural decay series of 238U and 232Th. Often, we also provide a calibration for anthropogenic radionuclides, such as 137Cs. The following data is used in the simulations:
The gamma-ray energy for 40K is taken as 1.461 MeV with an emission probability of PK=0.1067 gammas per decay;
It is assumed that the series of 238U is in secular equilibrium. All 458 gamma-ray emissions are implemented resulting in a total emission probability of PU= 2.197 gammas per decay;
Also for the 232Th-series secular equilibrium is assumed and all 346 emissions are implemented. The total emission probably is PTh= 2.628 gammas per decay;
The energy of the mono energetic gamma-ray emitter 137Cs is 661.66 keV with an emission probability of PCs= 0.8521 gammas per decay.
Modeling of detector response
Detector response was simulated using the MCNPX pulse height tally (F8-tally). This tally estimates the distribution of the energy deposition (energy spectrum) in (a model of) a physical detector. The unbroadened spectra (histograms) can be adapted to fit any energy resolution by performing a Gaussian energy broadening procedure on these histograms.
In the simulations the energy deposition in the detector was recorded in 300 10 keV bins to span an energy range from 0 to 3 MeV.
Stonehenge: the Medusa calibration facility
Stonehenge is a cubic shaped brick castle with a volume of about 1m3. The castle has a horizontal square (200x200 mm2) 800 mm deep opening at the front in which a detector under test may be entered. Inside the square gap a 20 cm diameter and 80 cm long PVC tube is inserted. The Stonehenge bricks are Dutch baked clay building stones measuring about 50x70x200 mm3 and having a density of about 2.32 kg/l.
The average nuclide activity of the setup is found by measuring 40K, 238U and 232Th concentrations for a large number of bricks from the setup. These measurements were performed in a HPGe detector system present at the Nuclear Accelerator Institute of the University of Groningen, according to a method described in the Dutch NORM NVN 5697.
For all three radionuclides present inside the stones, the homogeneity per nuclide concentration (defined as the standard deviation divided by the sample average) proved to better than 5%.
Monte Carlo evaluation of the Stonehenge facility
For Stonehenge to be a proper calibration facility, the size of the setup should be taken such, that it can be considered as an infinite source. This is important because for an infinite source, all radiation comes from the source itself and no radiation unaccounted for in the simulations can enter the detector under test.
The size of Stonehenge was taken such that the ideal of an infinite source is approached sufficiently. Simulations of radiation transport have shown that 99.9% of the radiation in the middle hole of the 1m3 cube setup comes from the setup bricks. Less than 0.1 percent of the radiation comes from the (low-activity sandstone) floor and walls surrounding the setup.
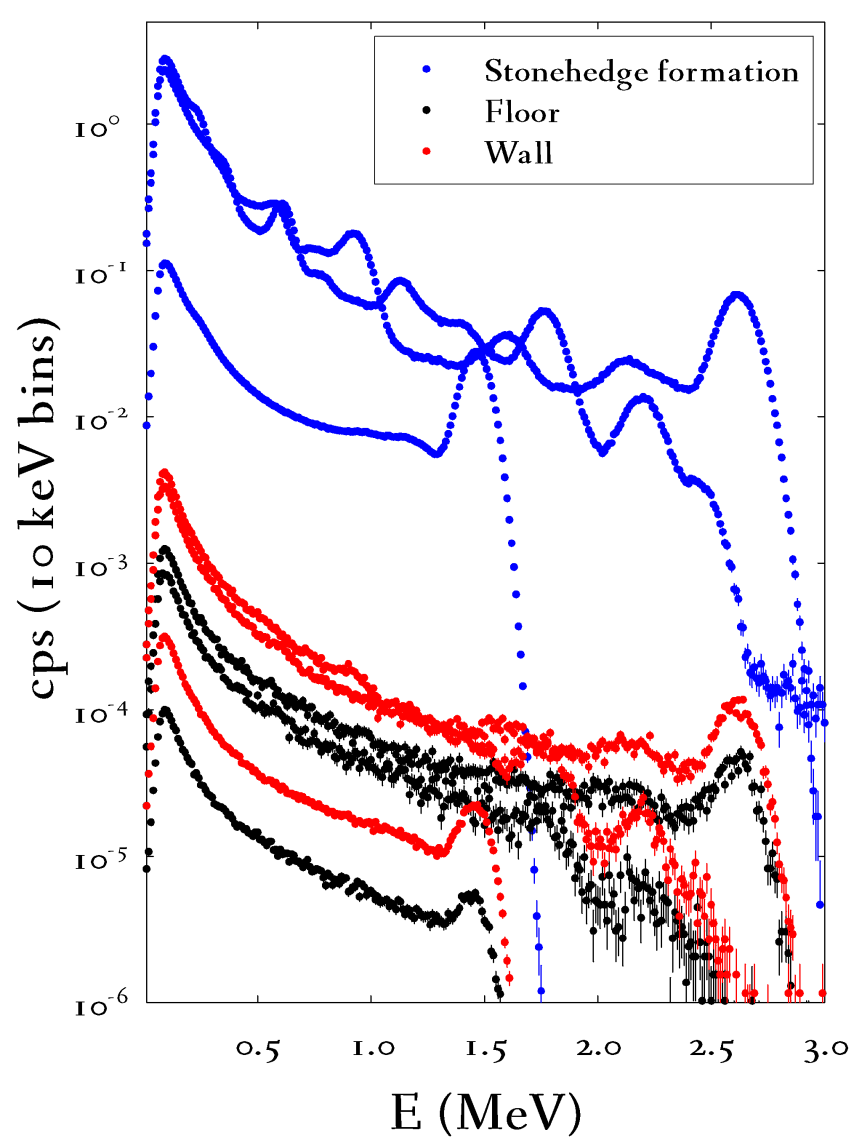
To test this, we have performed MC simulations of a 4x4x16 inch CsI detector inside the Stonehenge facility for three situations:
Stonehenge formation only with homogeneous activity distribution (blue spectra in figure below);
Stonehenge formation with underlying concrete floor with homogeneous activity distribution in the floor only (black spectra in figure below)
Stonehenge formation with adjacent wall with homogeneous activity distribution in the wall only (red spectra).
The spectra are Gaussian energy broadened to mimic a detector resolution of 10% at 662 keV.
As can be seen in figure 1, the contribution of walls and floor are minimal and can be neglected for all practical purposes.
Calibration of simulations
Calibration of a spectral gamma tool involves the following steps:
Measurement of a spectrum inside Stonehenge;
Normalization of the spectrum on the lifetime of the measurement;
Transformation of the measured (multi-channel) spectrum into an energy-calibrated spectrum;
Determination of the resolution of the detector system;
Determination of a generic scaling factor between the theoretical (MC calculated) detector response and the actual response inside Stonehenge;
Generation of standard spectra for a given application geometry (creation of a calibration file)
Here, we will discuss these steps in some detail.
Lifetime correction
The lifetime of a measurement is the time the acquisition system was actually "open" to record events ("counts"). The lifetime is equal to the real time minus the deadtime of the system. The deadtime generally scales with the countrate on the system. Most systems have deadtimes between 1 and 20 microseconds per count.
After having measured the spectrum, it needs to be normalized against the lifetime of the measurement. This is done by dividing each channel by the lifetime.
Energy calibration
A multichannel spectrum merely represents a histogram of the intensity of the light pulses resulting from radiation capture inside a scintillator crystal. These light pulses are linearly transformed into voltage pulses that are subsequently digitized by acquisition hardware. The light output of the crystal is linear to the energy of the captured radiation. So, in theory, there exists a linear relationship between the channel positions of peaks in the spectrum and the energy of the radiation leading to these peaks.
Energy calibration of a "raw" multichannel spectrum therefore involves the determination of a mapping function between channel numbers and energies.
Despite the linear relation expected from theory, we use a second order mapping function, described by three parameters a0, a1 and a2. These a-factors are the coefficients of the 2nd order function translating the channel numbers into energy.
a0 represents a zero-offset often present in acquisition systems;
a1 represents the (detector temperature dependent) linear scaling factor described above;
a2 represents an alinear correction to the channel-energy scaling
In an ideal multi-channel acquisition system, the factors a0 and a2 would be zero. And a1 varies solely with the temperature of the system (c.f. Hendriks et al, 2001). However, in practice most systems show some offset (a0<>0) and sometimes even some alinearity (a2<>0). In general, smaller a0 and a2 imply better quality acquisition systems.
Energy resolution
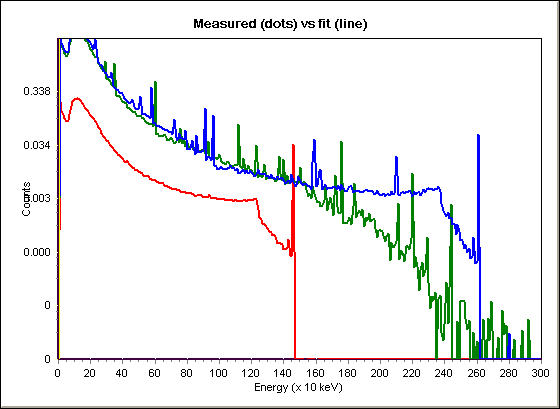
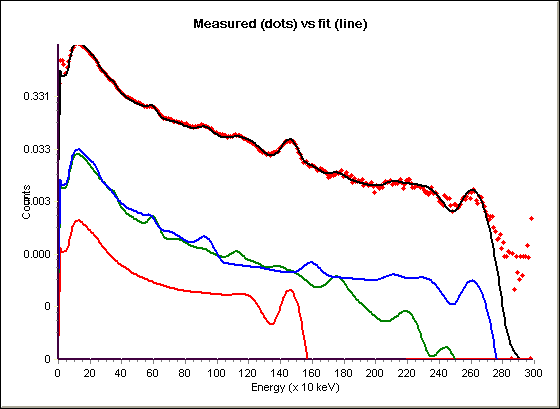
Determination of the energy resolution of the system is a rather straightforward procedure. To establish the energy resolution of a detector system, its Stonehenge calibration spectrum is approximated by a set of standard spectra. One of the "tuning" variables of the standard spectra is their spectral width.
The output of the MC simulations are so-called "unbroadened standard spectra". To arrive at spectra that actually fit the calibration spectrum, each standard spectrum is broadened by an energy-dependent Gaussian broadening function (see e.g. (Hendriks, 2001) and &
). The broadening is optimized such that a perfect match is obtained with the peakwidth in the calibration spectrum .
Generic Scaling
In theory, the MC model used to create standard spectra, will fully describe the source-detector system. When these standard spectra are used to fit a calibration spectrum, one would expect to get the exact 40K, 238U and 232Th concentrations of the calibration source as multiplication factors for the standard spectra (see Hendriks 2001) for a discussion on the least squares fitting model used). However, the MC model cannot fully include losses due to imperfections in the crystal and electronics. These losses can be summarized in an efficiency factor %22%20aria-hidden%3D%22true%22%3E%0A%20%3Cuse%20xlink%3Ahref%3D%22%23E1-MJMATHI-3D5%22%20x%3D%220%22%20y%3D%220%22%3E%3C%2Fuse%3E%0A%3C%2Fg%3E%0A%3C%2Fsvg%3E) that is needed to scale the standard spectra to account for these losses. For most systems, lies between 0.90 and 0.98 implying most systems have an overall efficiency of 90%-98%.
that is needed to scale the standard spectra to account for these losses. For most systems, lies between 0.90 and 0.98 implying most systems have an overall efficiency of 90%-98%.
Standard spectra for each given geometry
The broadening and scaling are detector dependent parameters and are independent of geometry of the system. Once these parameters are determined, one can use these to create standard spectra for other (application-dependent) geometries.
Under the assumption that the MC model for a detector in an application-dependent geometry is just as valid as for the Stonehenge facility, one can create proper standard spectra for such other geometries by simply applying the broadening and scaling found for the detector-Stonehenge system to the standard spectra for the wanted geometry.
Despite the fact that there is not much reason to question the validity of the MC models for the application geometries listed before, we have thoroughly tested the validity of such models by testing against field measurements.
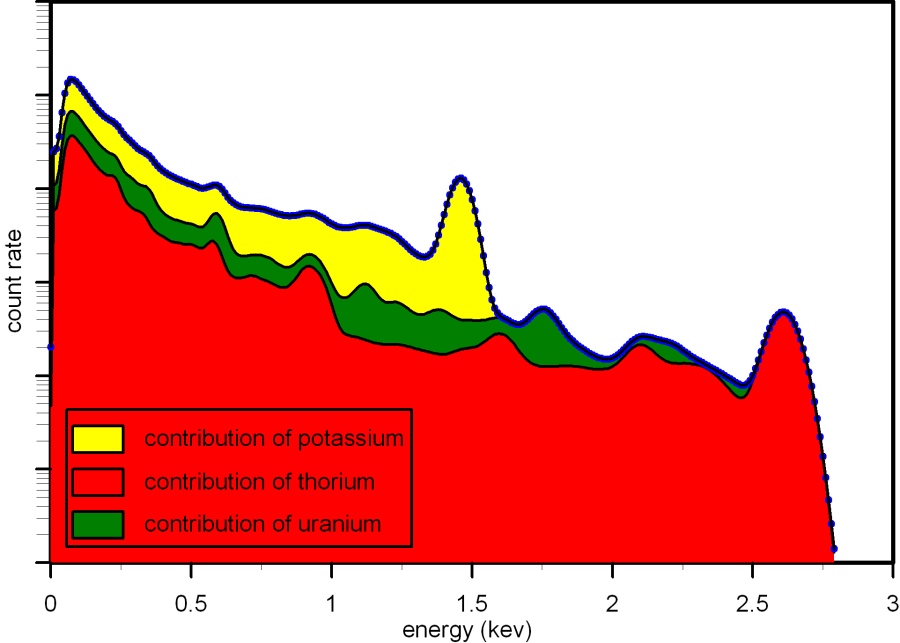
Finally, the result of the calibration procedure is a set of standard spectra that can be used in Full Spectrum Analysis to analyze gamma ray data measured in the field (see figure). The output of the calibration procedure is a spreadsheet containing the spectra, and a Medusa Calibration File (MCF) that can be used in the Medusa spectral analysis software (GAMMAN).
This approach facilitates a new, practical and precise, approach to the calibration of gamma detectors. This method allows to create standard spectra of a given detector against sources of virtually any shape and density.
Comparison of the calibrations to other calibration pits
Gamma-ray logging tools are applied worldwide. As a result, calibration facilities at various locations are used to calibrate these gamma-ray logging systems. Several attempts have been made to cross-correlate well known calibration pits, but this cross-correlation does not include calibration facilities in Europe or private company calibration facilities.
We have set-up a framework that gives the possibility to interlink all calibration facilities worldwide by using ‘tools of opportunity’ – tools that have been calibrated in different calibration facilities, whether this usage was on a coordinated basis or by coincidence.
To compare the measurement of different tools, it is important to understand the behaviour of the tools in the different calibration pits. Borehole properties, such as diameter, fluid, casing and probe diameter strongly influence the outcome of gamma-ray borehole logging. Logs need to be properly calibrated and compensated for these borehole properties in order to obtain in-situ grades or to do cross-hole correlation. Some tool providers provide tool-specific correction curves for this purpose. Others rely on reference measurements against sources of known radionuclide concentration and geometry.
In this article, we present an attempt to set-up a framework for transferring ‘local’ calibrations to be applied ‘globally’. This framework includes corrections for any geometry and detector size to give absolute concentrations of radionuclides from borehole measurements. This model is used to compare measurements in the calibration pits of Grand Junction, located in the USA; Adelaide (previously known as AMDEL), located in Adelaide Australia; and Stonehenge, located at Medusa Explorations BV in the Netherlands.
References
de Meijer, R.J. 1998. Heavy minerals: from 'Edelstein' to Einstein. Journal of Geochemical Exploration, 62: 81-103.
de Meijer, R.J., Stapel, C., Jones, D.G., Roberts, P.D., Rozendaal, A. and Macdonald, W.G. 1997. Improved and New Uses of Natural Radioactivity in Mineral Exploration and Processing. Exploration Mining Geology, 6: 105-117.
Grasty, R.L., Glynn, J.E. and Grant, J.A. 1985. The analysis of multichannel airborne gamma-ray spectra. Geophysics . 50.
Hendriks, P.H.G.M., Limburg, J., de Meijer, R.J. 2001. Full-spectrum analysis of natural gamma-ray spectra. Journal of Environmental Radioactivity, 53: 365-380.
Hendriks, P.H.G.M., Maucec, M. and de Meijer, R.J. 2002. MCNP modelling of scintillation-detector [gamma]-ray spectra from natural radionuclides. Applied Radiation and Isotopes, 57: 449-457.
Medusa. Medusa Explorations BV.
Minty, B.R.S. 1992. Airborne gamma-ray spectrometric background estimation using full spectrum analysis. Geophysics, 57: 279-287.
SoilCompany. The Soil Company.
Stromswold, D.C. 1995. CALIBRATION FACILITES FOR BOREHOLE AND SURFACE ENVIRONMENTAL RADIATION MEASUREMENTS. Journal of Radioanalytical and Nuclear Chemistry, 194: 393-401.
Young, J.H. 1980. Spectral Gamma-Ray (KUTH) borehole logging. Society of Petroleum Engineers, SPE 9465.