Best practices for drone borne surveying
Practical aspects
Drones
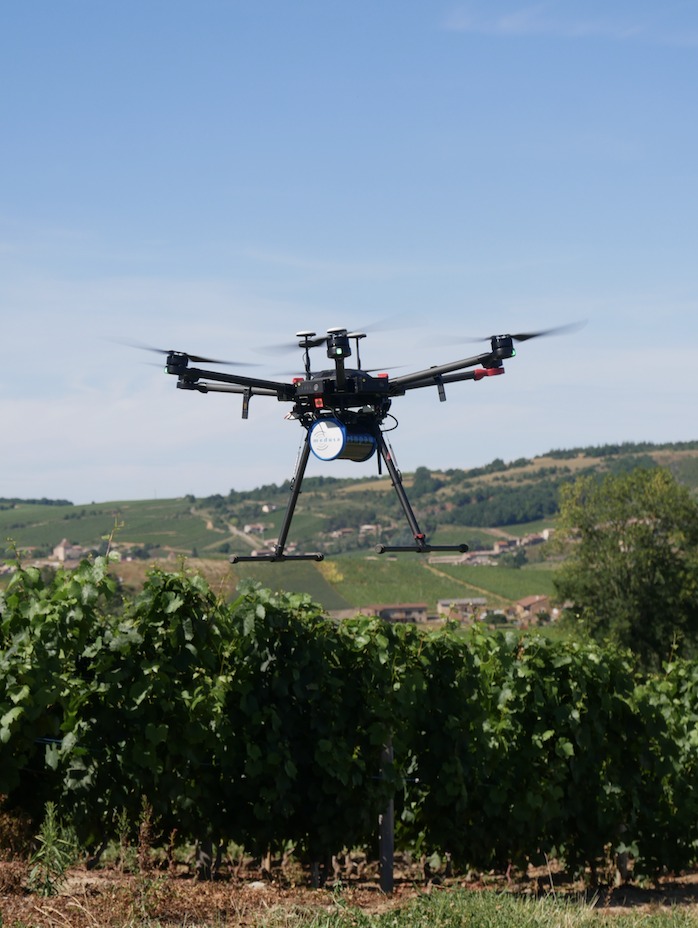
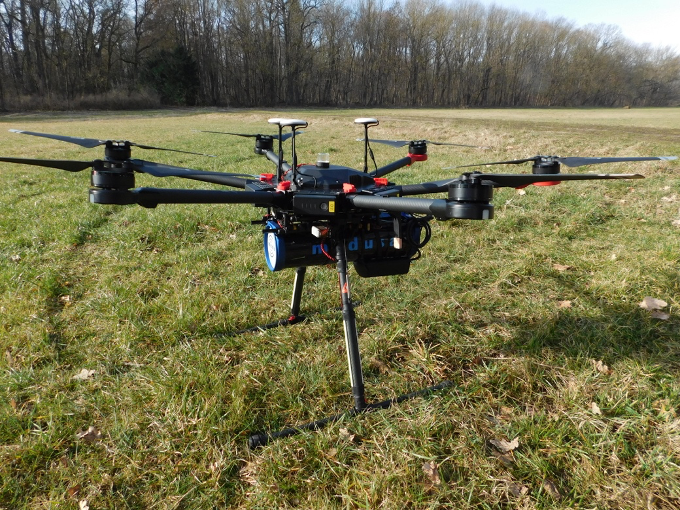
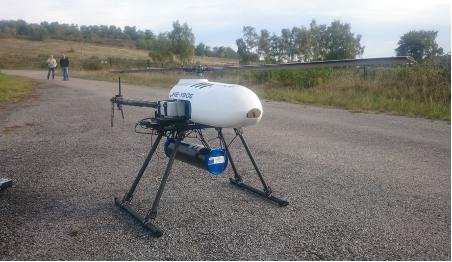
The gamma spectrometer can be mounted under various AUV's. Ranging from commercial drones to gasoline powered helicopters. An often used commercial available drone is a DJI Matrice 600 Pro.
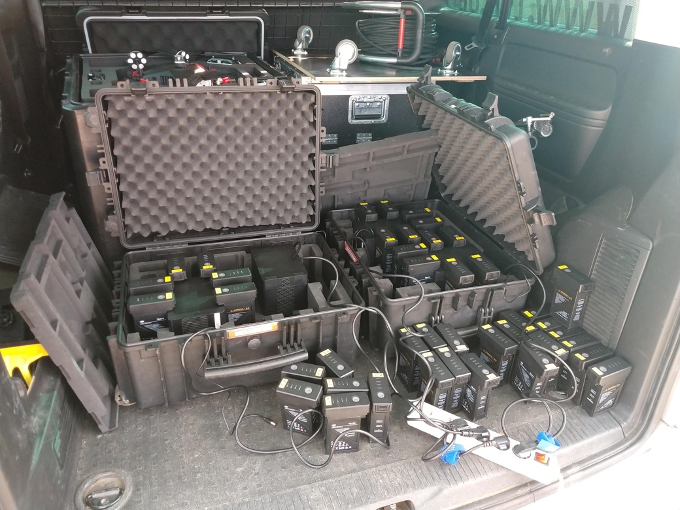
Please note that, depending on the drone used, you will need a lot of batteries for a full day of operation! A DJI Matrice 600 Pro equipped with an MS-1000 can fly 10-15 minutes on one pack of batteries. This flight time increases with decreasing detector size and can reach up to 25 minutes on a single set of batteries for an MS-350.
Mounting
The Medusa sensors have a mounting bracket (described here: Mounting), but this a heavy bracket. Some clients make a carbon version of this bracket for mounting. but in many projects the sensor is attached to the drone with tie-wraps.
Survey planning
A drone borne survey differs not very much from a quad-borne or walking survey, however mostly the sensor that you use is smaller and thus counting less, the drone is flown at a certain height and the number of counts measured decrease with height. Therefore, we recommend to fly low and slow. How low and slow depends on:
Resolution that you will need
Terrain (trees etc)
Size of the geological/soil structures you expect to see or want to see
Detector settings
The real challenge in using an gamma-ray spectrometer under a drone is the limited payload of the platform. Although there is a large variety of drones available nowadays, most of them have a limited maximum total takeoff weight of <25kg which means that their payload capacity does not exceed 10-15 kg.
To overcome the weight limits one should very carefully investigate and optimize the optimum size, shape and crystal type to be used. A more detailed description of this research can be found in Size (and shapes) does matter!?. But basically, the size of a detector determines the accuracy of the measurement. Remember the gamma sensor is a passive instrument. Like a photo camera, the quality of the “image” depends on the amount or radiation (“light”) seen by the sensor during a certain amount of time (livetime i.e. “shutter speed”). A larger detector will "count" more gamma-ray in the same time period than a smaller detector. This means that the smaller the sensor, the longer you will have to measure to get the same data quality.
For mapping European farmland, we usually set the acquisition speed of an MS-1000 to 0.3 Hz. This means each spectrum has a live time of 3s. Experienced users choose to use 1Hz data acquisition speed and sum data during post processing if needed. For a smaller detector we recommend to scale the acquisition speed with the volume of the sensor. The acquisition speed of an MS-350 will then be 0.1 Hz. This means each spectrum has a live time of 10s.
Flight settings
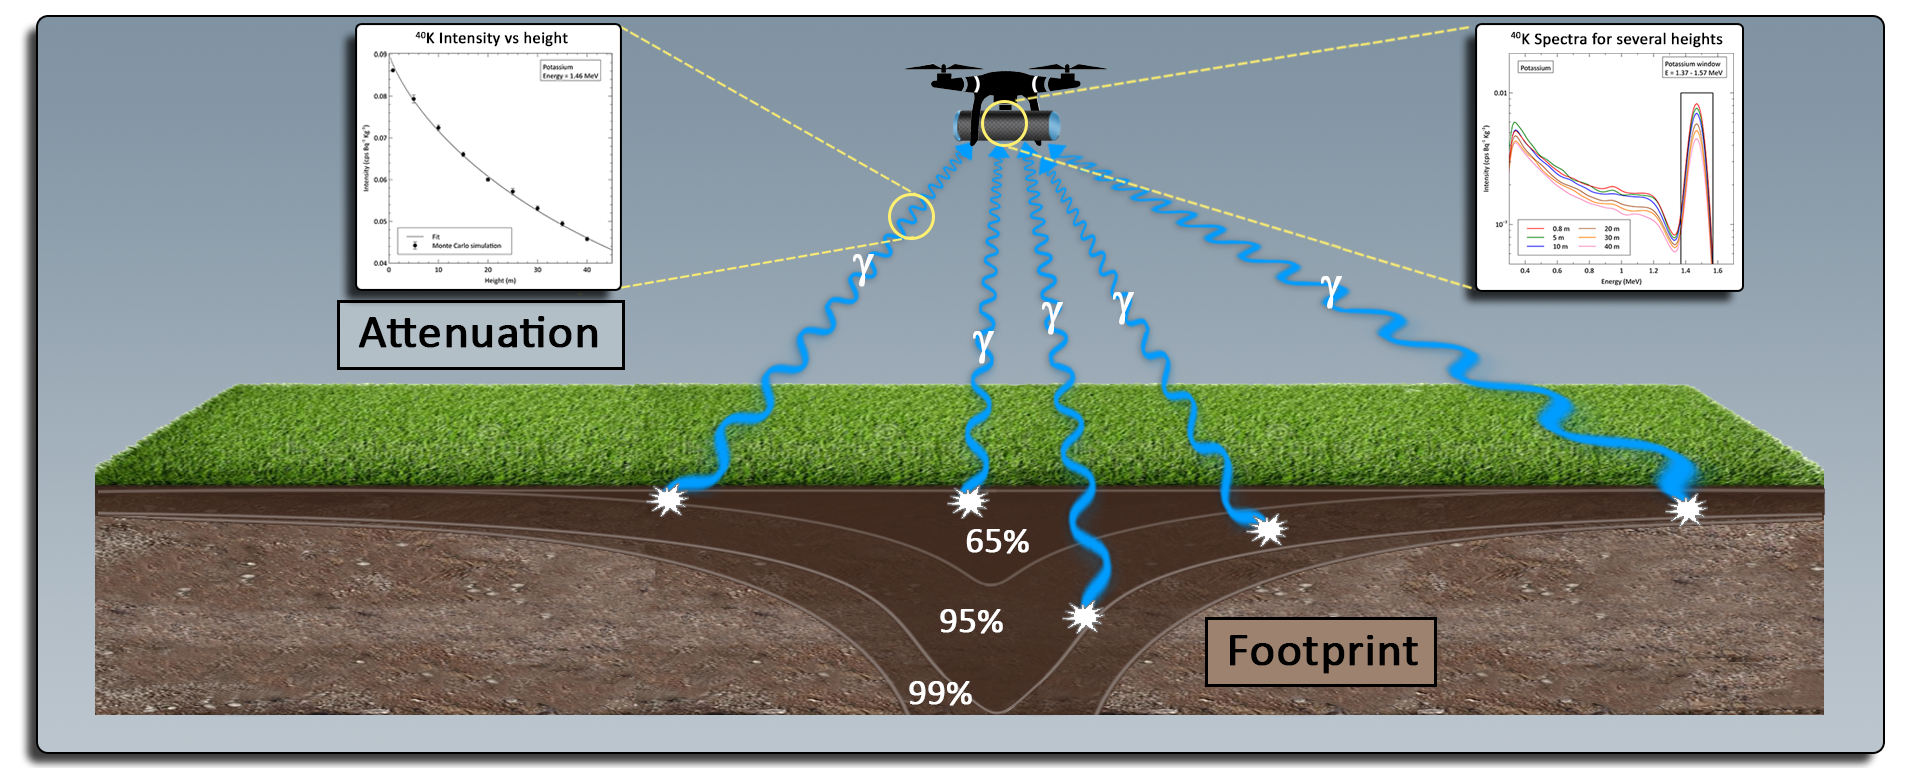
When a gamma-ray spectrometer is placed under a drone an brought into the air, the measured signal will change. The signal will be attenuated and the footprint will change. All these effects will determine the flight settings.
Flight speed
The speed you can fly is dependent on the resolution you require. This depends on the structures you are looking for. If you look for small-scale spatial variations (e.g. old river beds, with a width of 5 m) fly slower. If you are only interested in large-scale variations (on the scale of 250 m) fly faster.
Most work is flown at a speed of 2-10 m/s. At 3 m/s and a measurement frequency of 0.3Hz, you will have one sample point every 9 m. If you intend to have a line spacing of 10 m between the survey lines, a higher resolution along the line does not give additional information. As a rule of thumb, the distance between the sample points should be as large as the distance between your survey lines. The wiki page on On accuracy and spatial resolution gives more information on this.
The table below show some settings that you can use for mapping with an MS-1000.
Line spacing | survey speed | sample frequency | sample distance |
|---|---|---|---|
10 m | 3 m/s | 0.3 Hz | 9 m |
20 m | 6 m/s | 0.3 Hz | 18 m |
25 m | 8 m/s | 0.3 Hz | 24 m |
50 m | 16 m/s | 0.3 Hz | 48 m |
Height of measurement
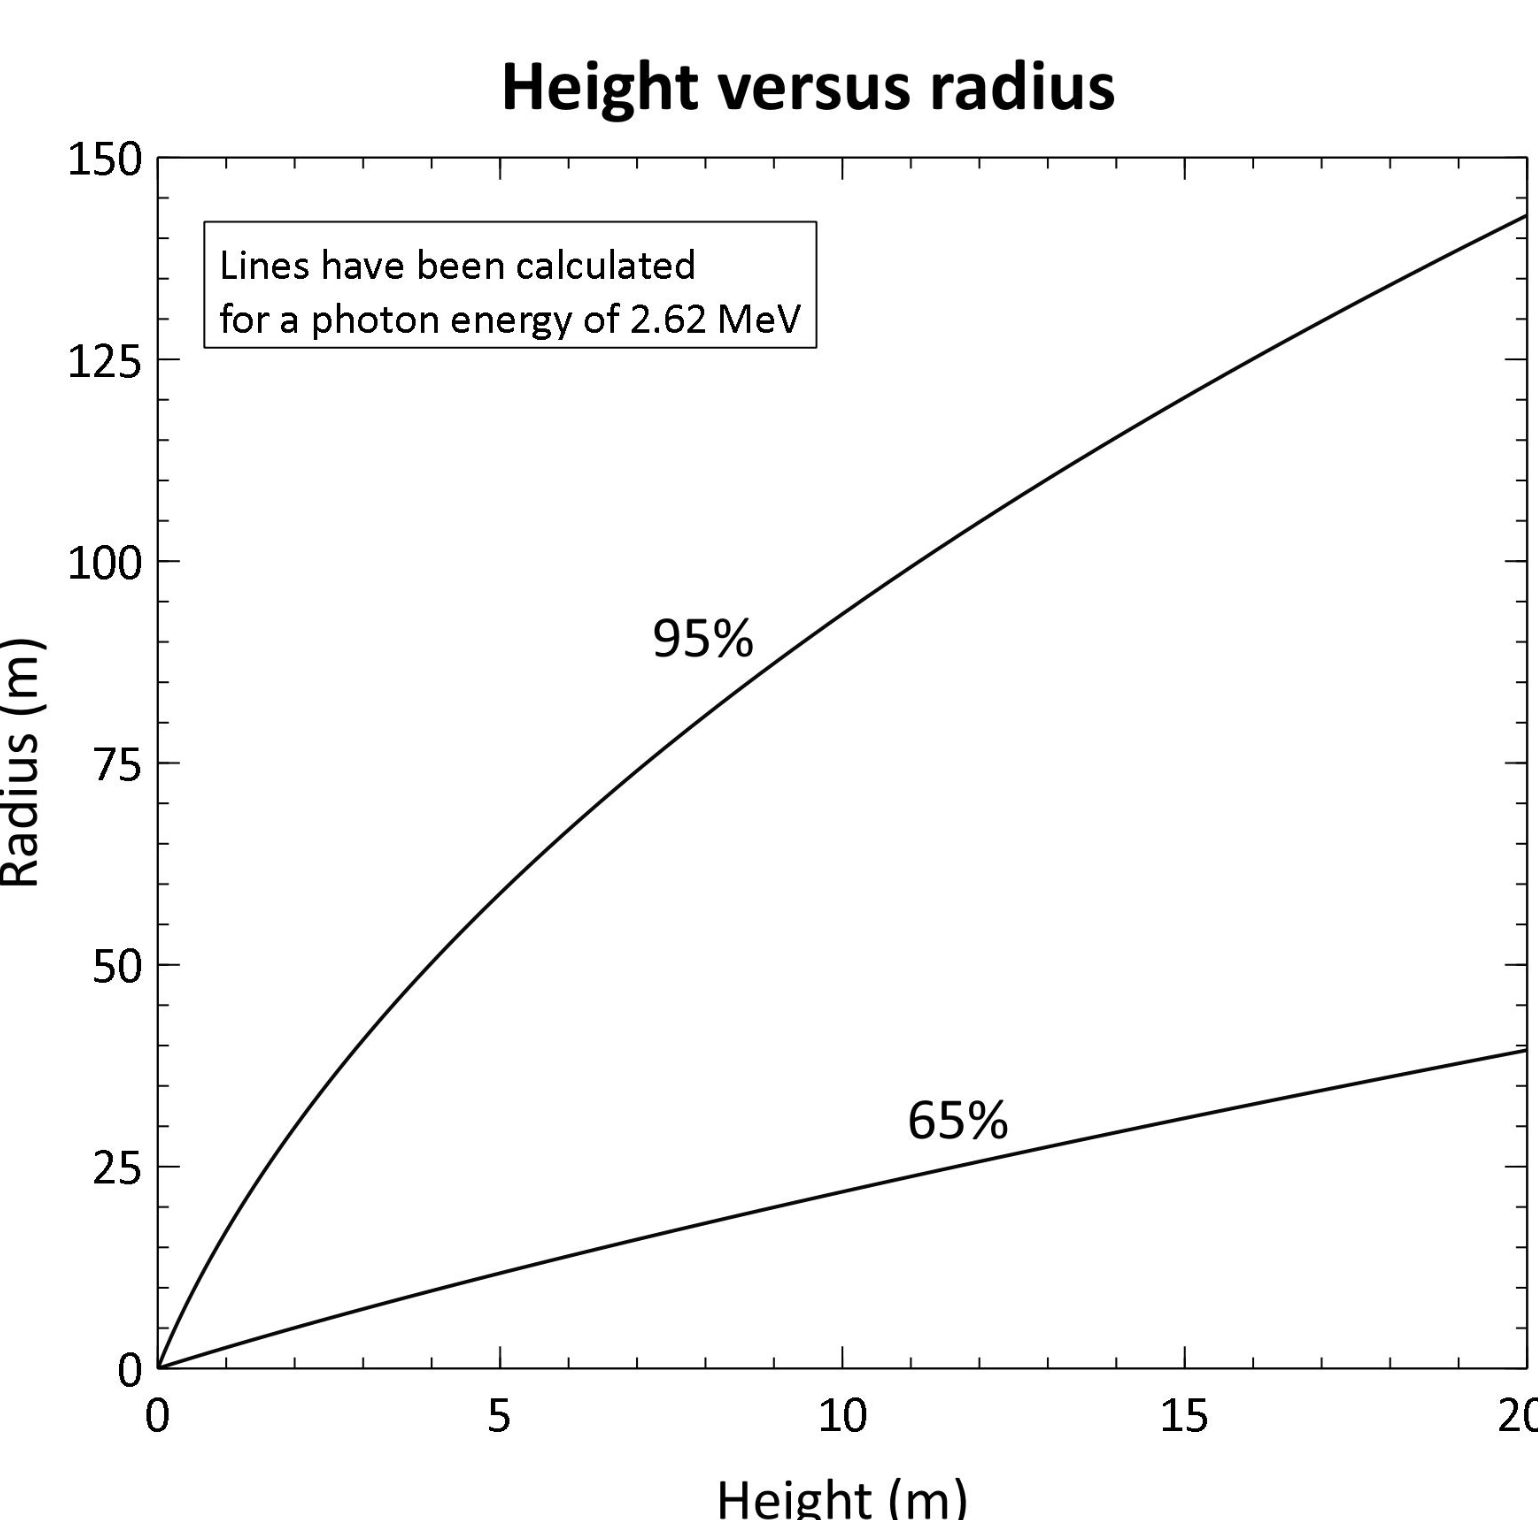
Most surveys we do with drones are flown at elevations between 5m and 30m. The higher, the larger the groundspot/footprint (the lower the resolution) and the bigger the absorption effects by air. As a rule of thumb: the radius of the ground spot is more or less 2 times the drone’s elevation. This means that at 5 m height and a line spacing of 10 meter, all soil is sampled.
 |
|---|
Figure: Relation between measurement height and the radius of the footprint. |
Increasing the height will reduce the number of counts measured and will therefore reduce the accuracy. We can overcome this loss in counts by increasing the size of the detector or flying slower. The table below shows some numbers on the loss of signal for different elevations. The exact loss of signal depends on the type of radionuclide measured. Therefore, a range in loss of signal is given. The Gamman software can correct for this loss in signal due to height above the ground with the airborne corrections wizzard.
Height above ground | Estimation of % loss of signal | 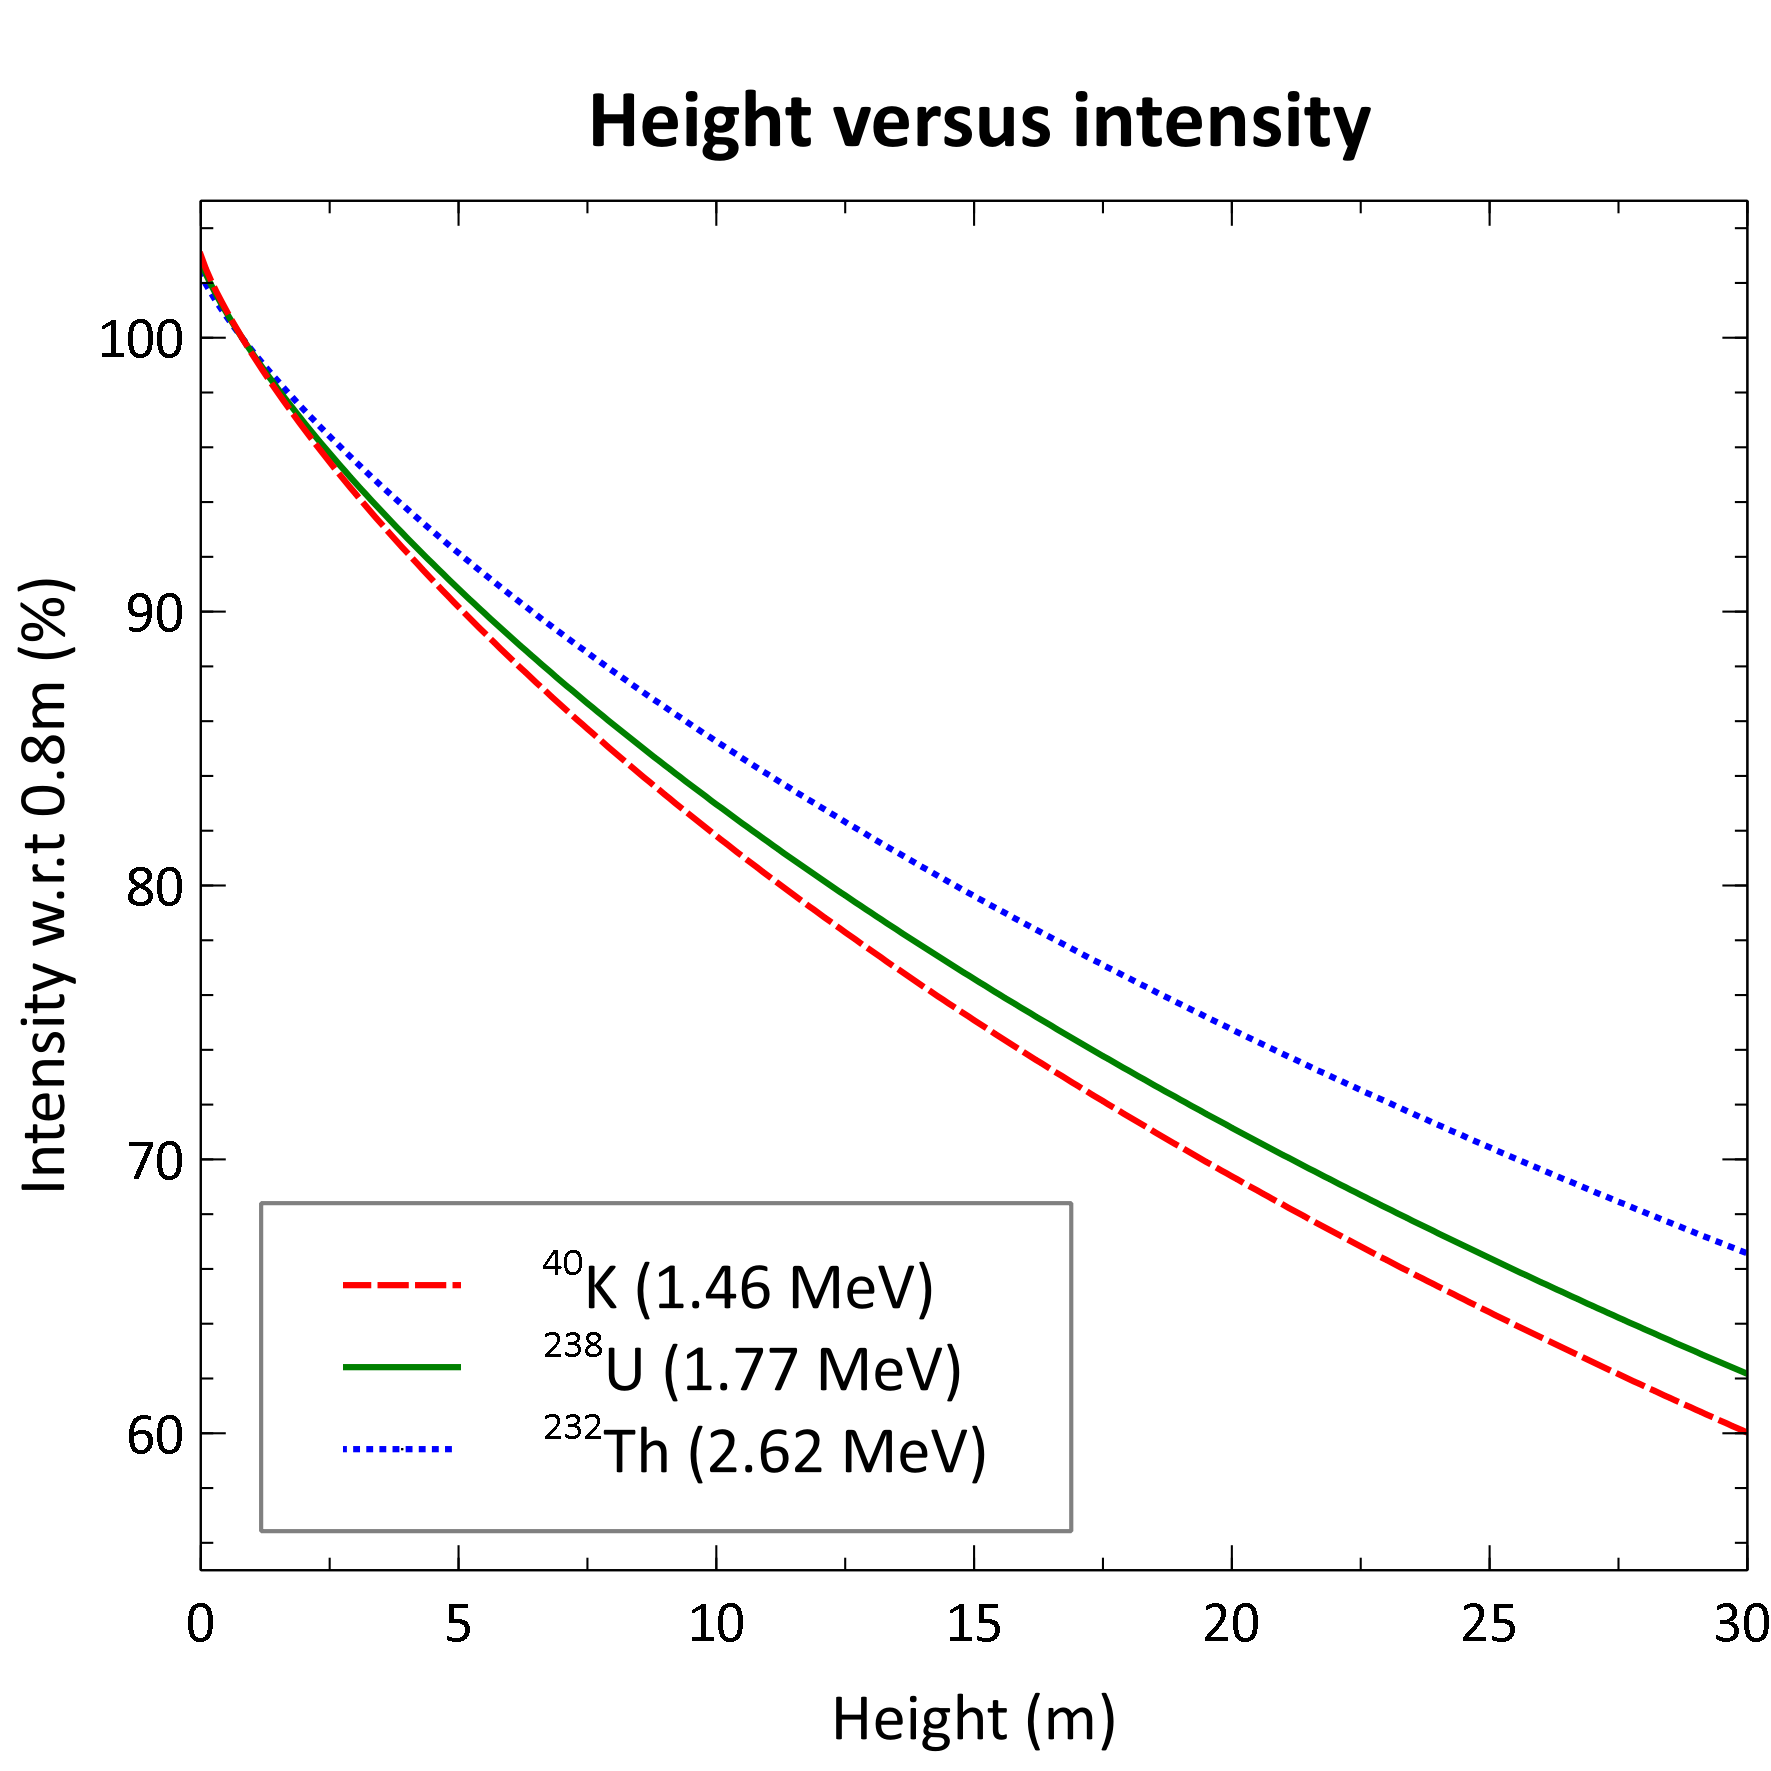 |
|---|---|---|
5 m | 5-10% | |
10 m | 10-20% | |
20 m | 25-35% | |
30 m | 30-40% |
Line spacing
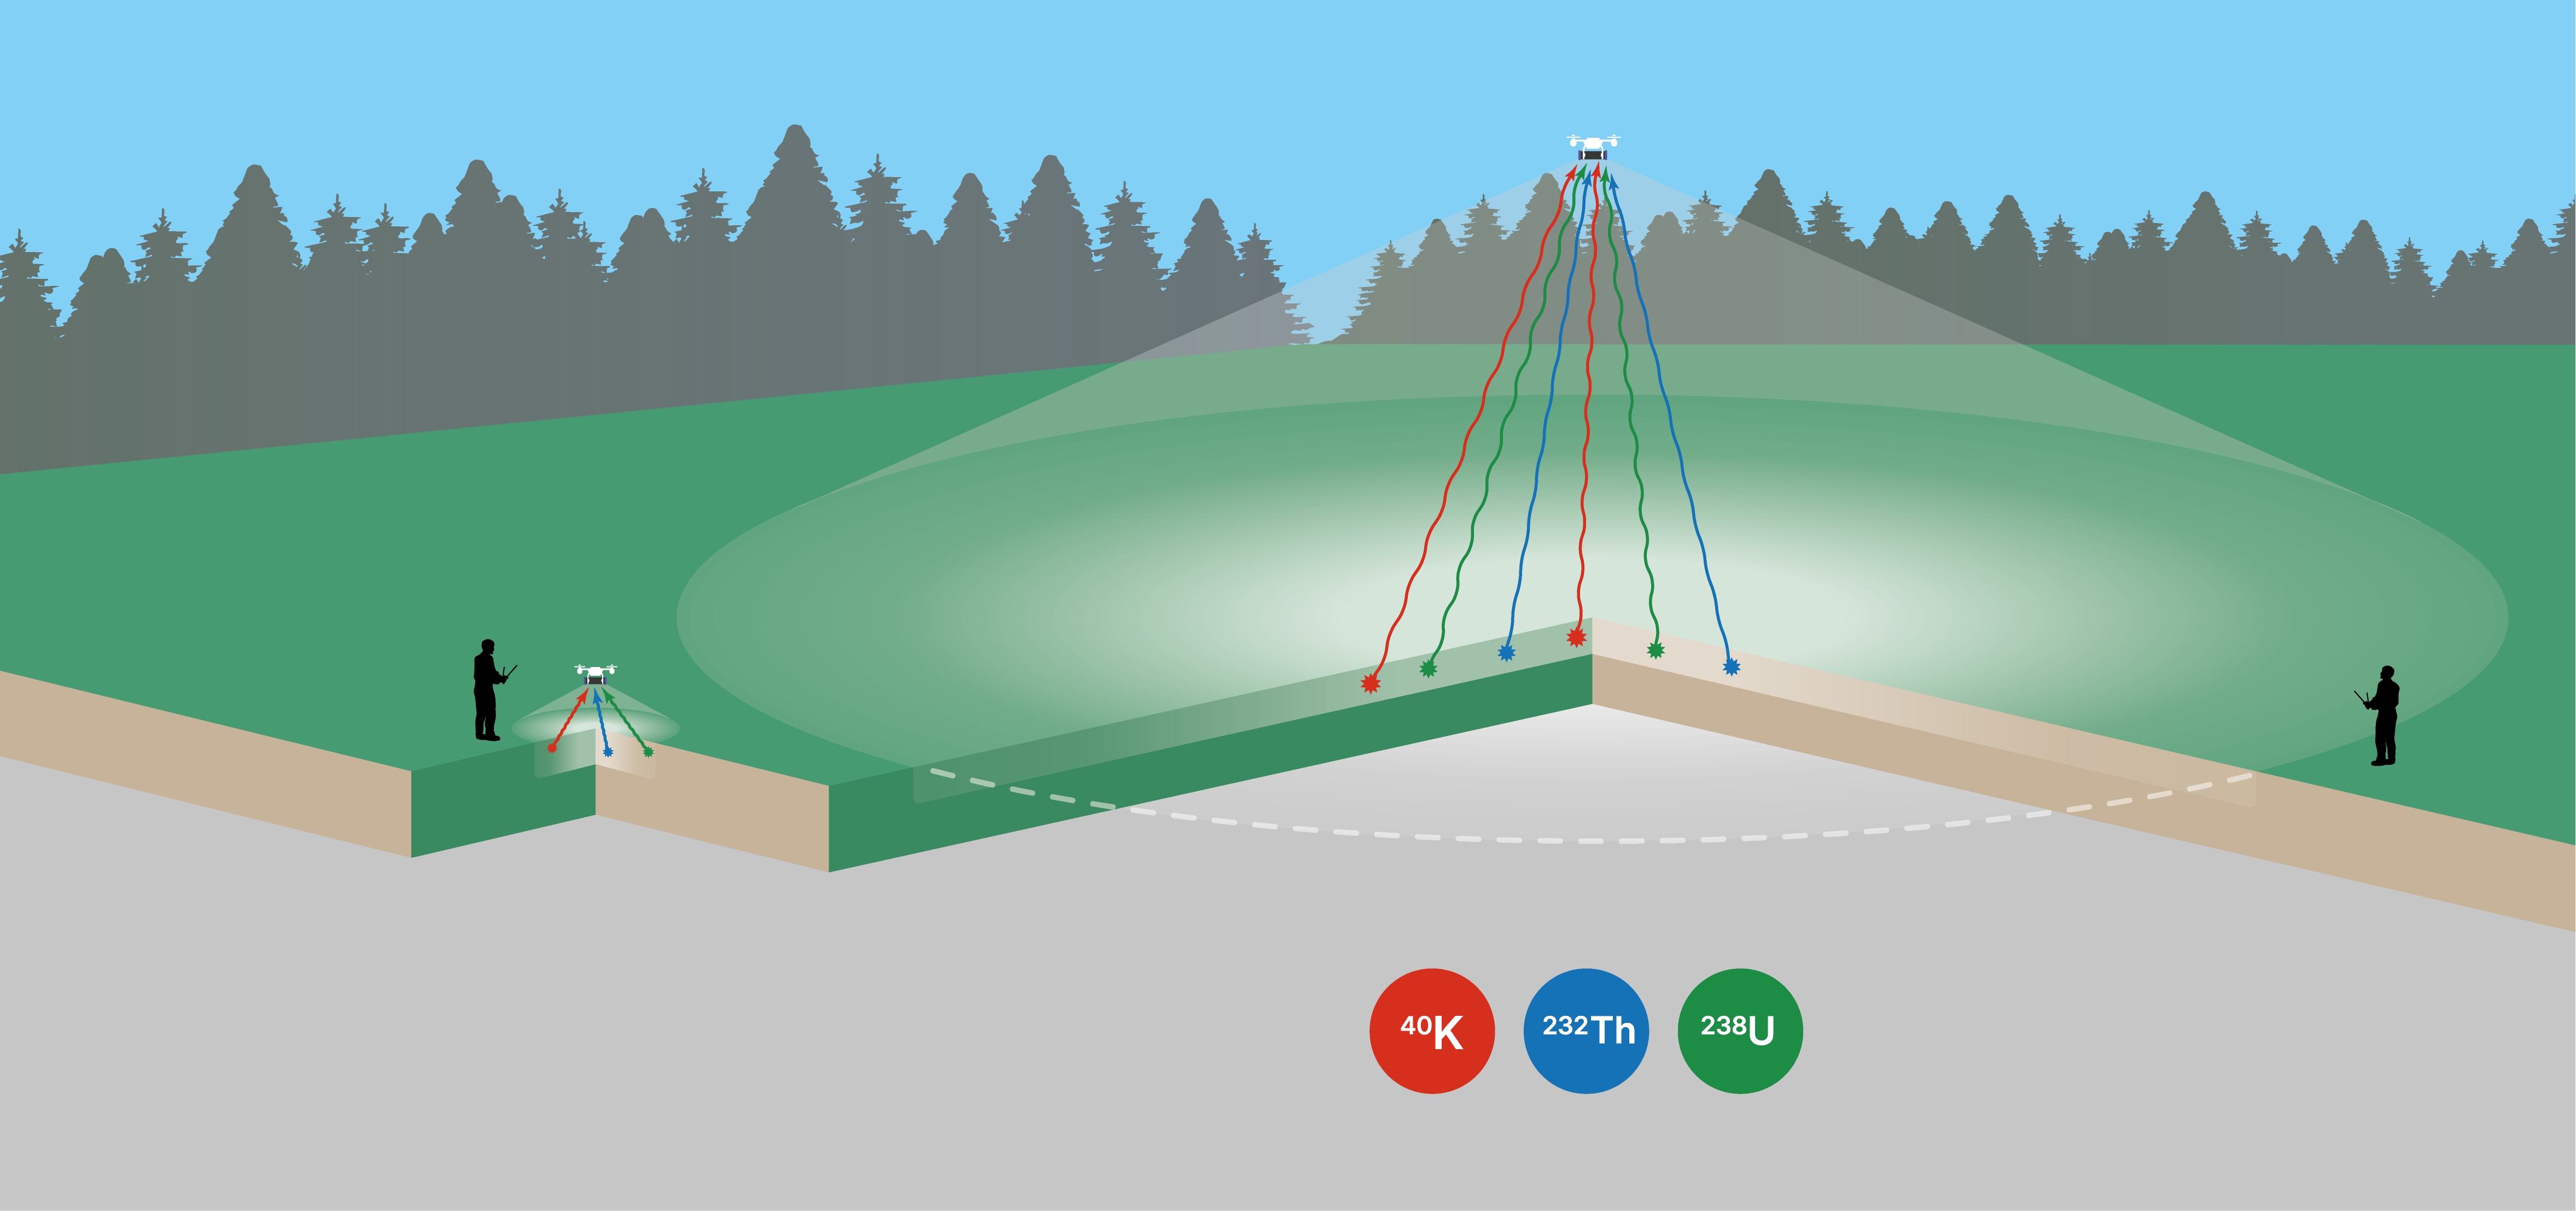
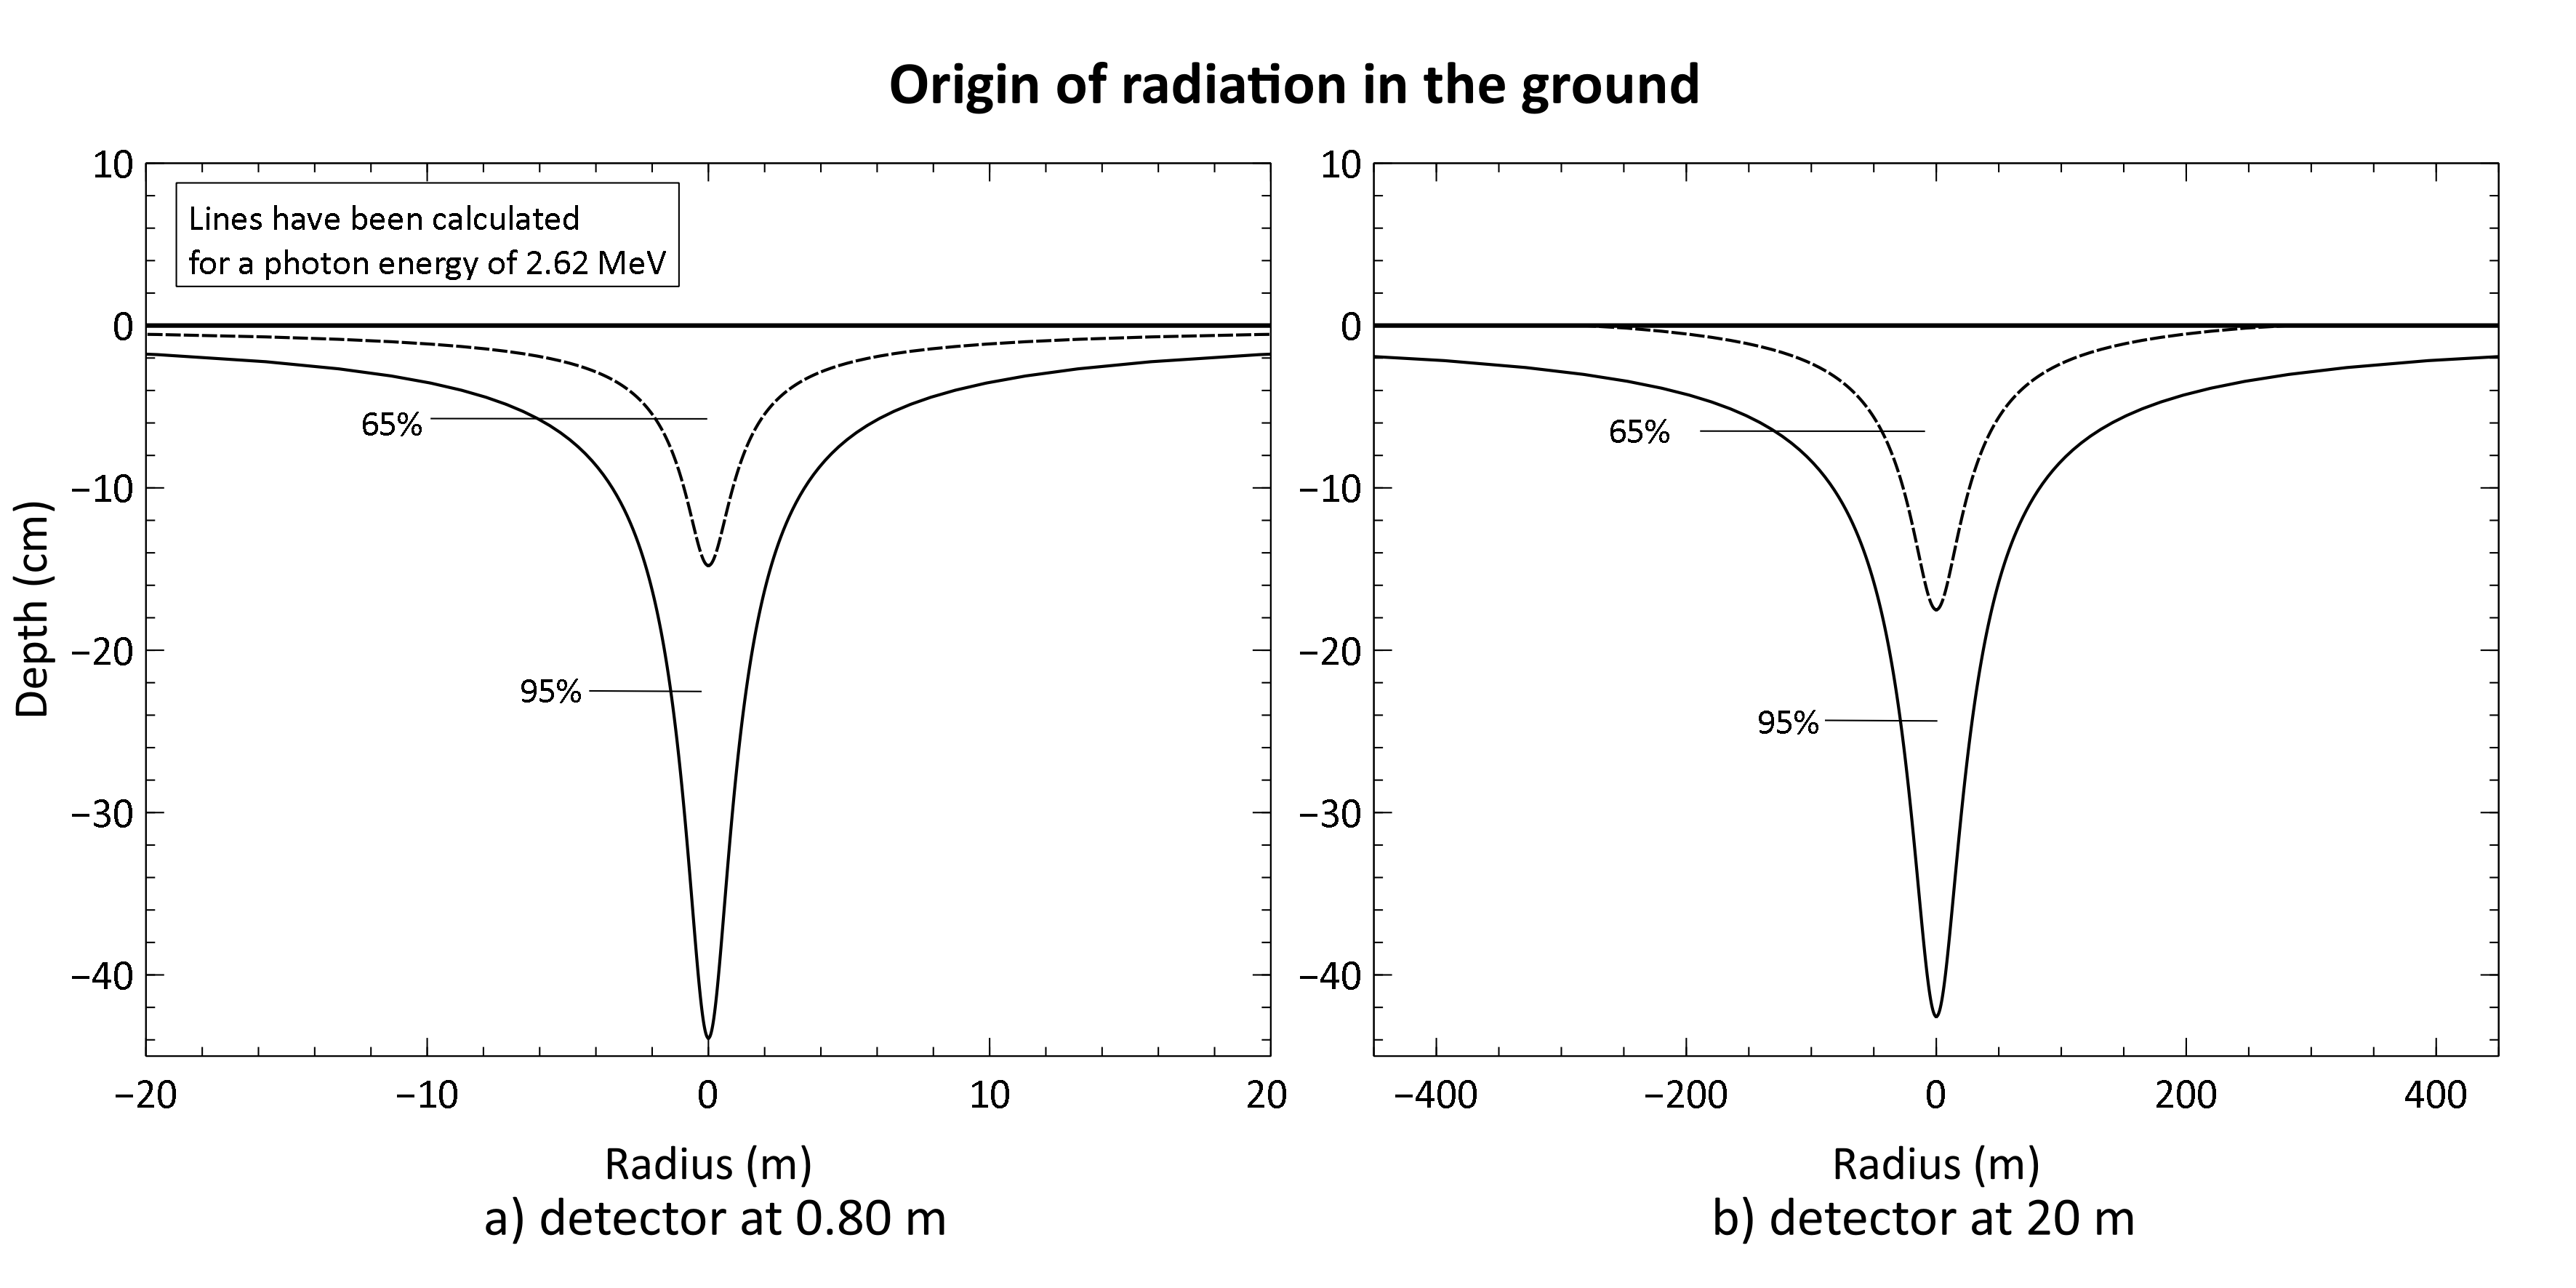
The line spacing determines the spatial resolution of your final map. A line spacing for mapping farmland is in the range of 10-20 m. The maximum spatial resolution that can be achieve with a survey has to do with the origin of radiation that is measured by the detector. The figures below illustrate the the increase in the origin of radiation with increasing detector height. It is recommended to choose a line spacing that is equal to the radius of the origin of 65% of the radiation detected by your spectrometer.
 |
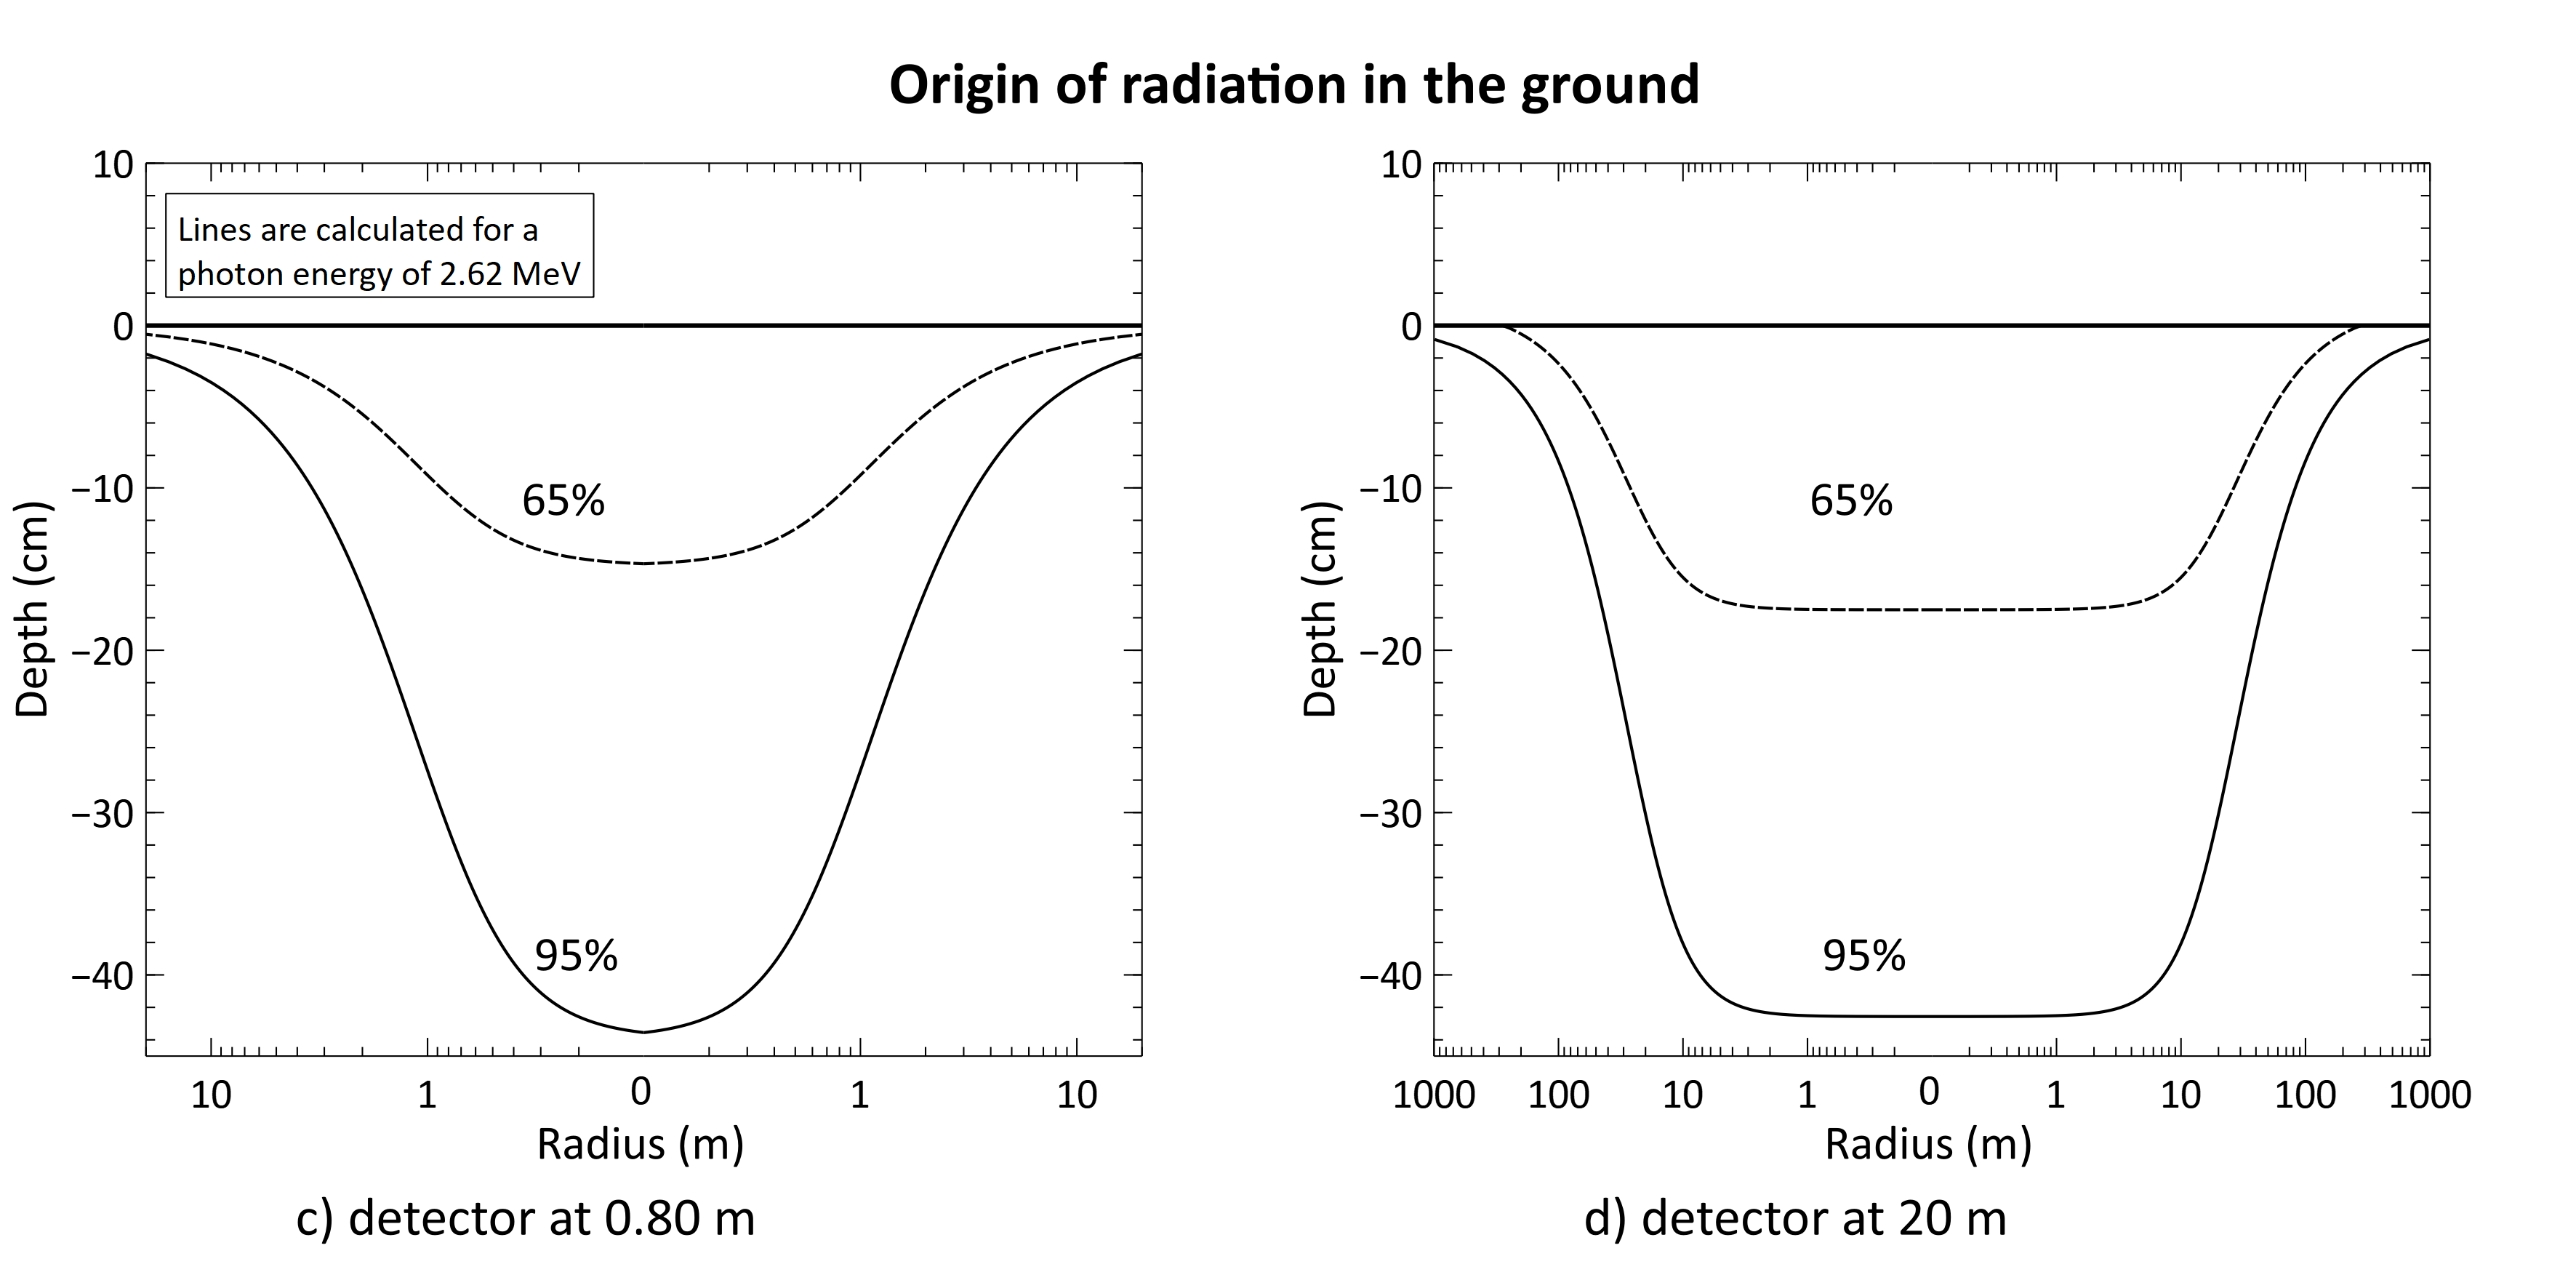 |
Figure: a,b) Cross section through the soil indicating the origin of radiation for two selected measurement heights. Note that the horizontal scale is in meters while the vertical scale is in centimeters. The depth of measurement is independent of measurement height (a large amount of the signal (65%) originates from a soil layer that has a depth of 15-20 cm). The footprint (radius of this signal) depends on measurement height. |
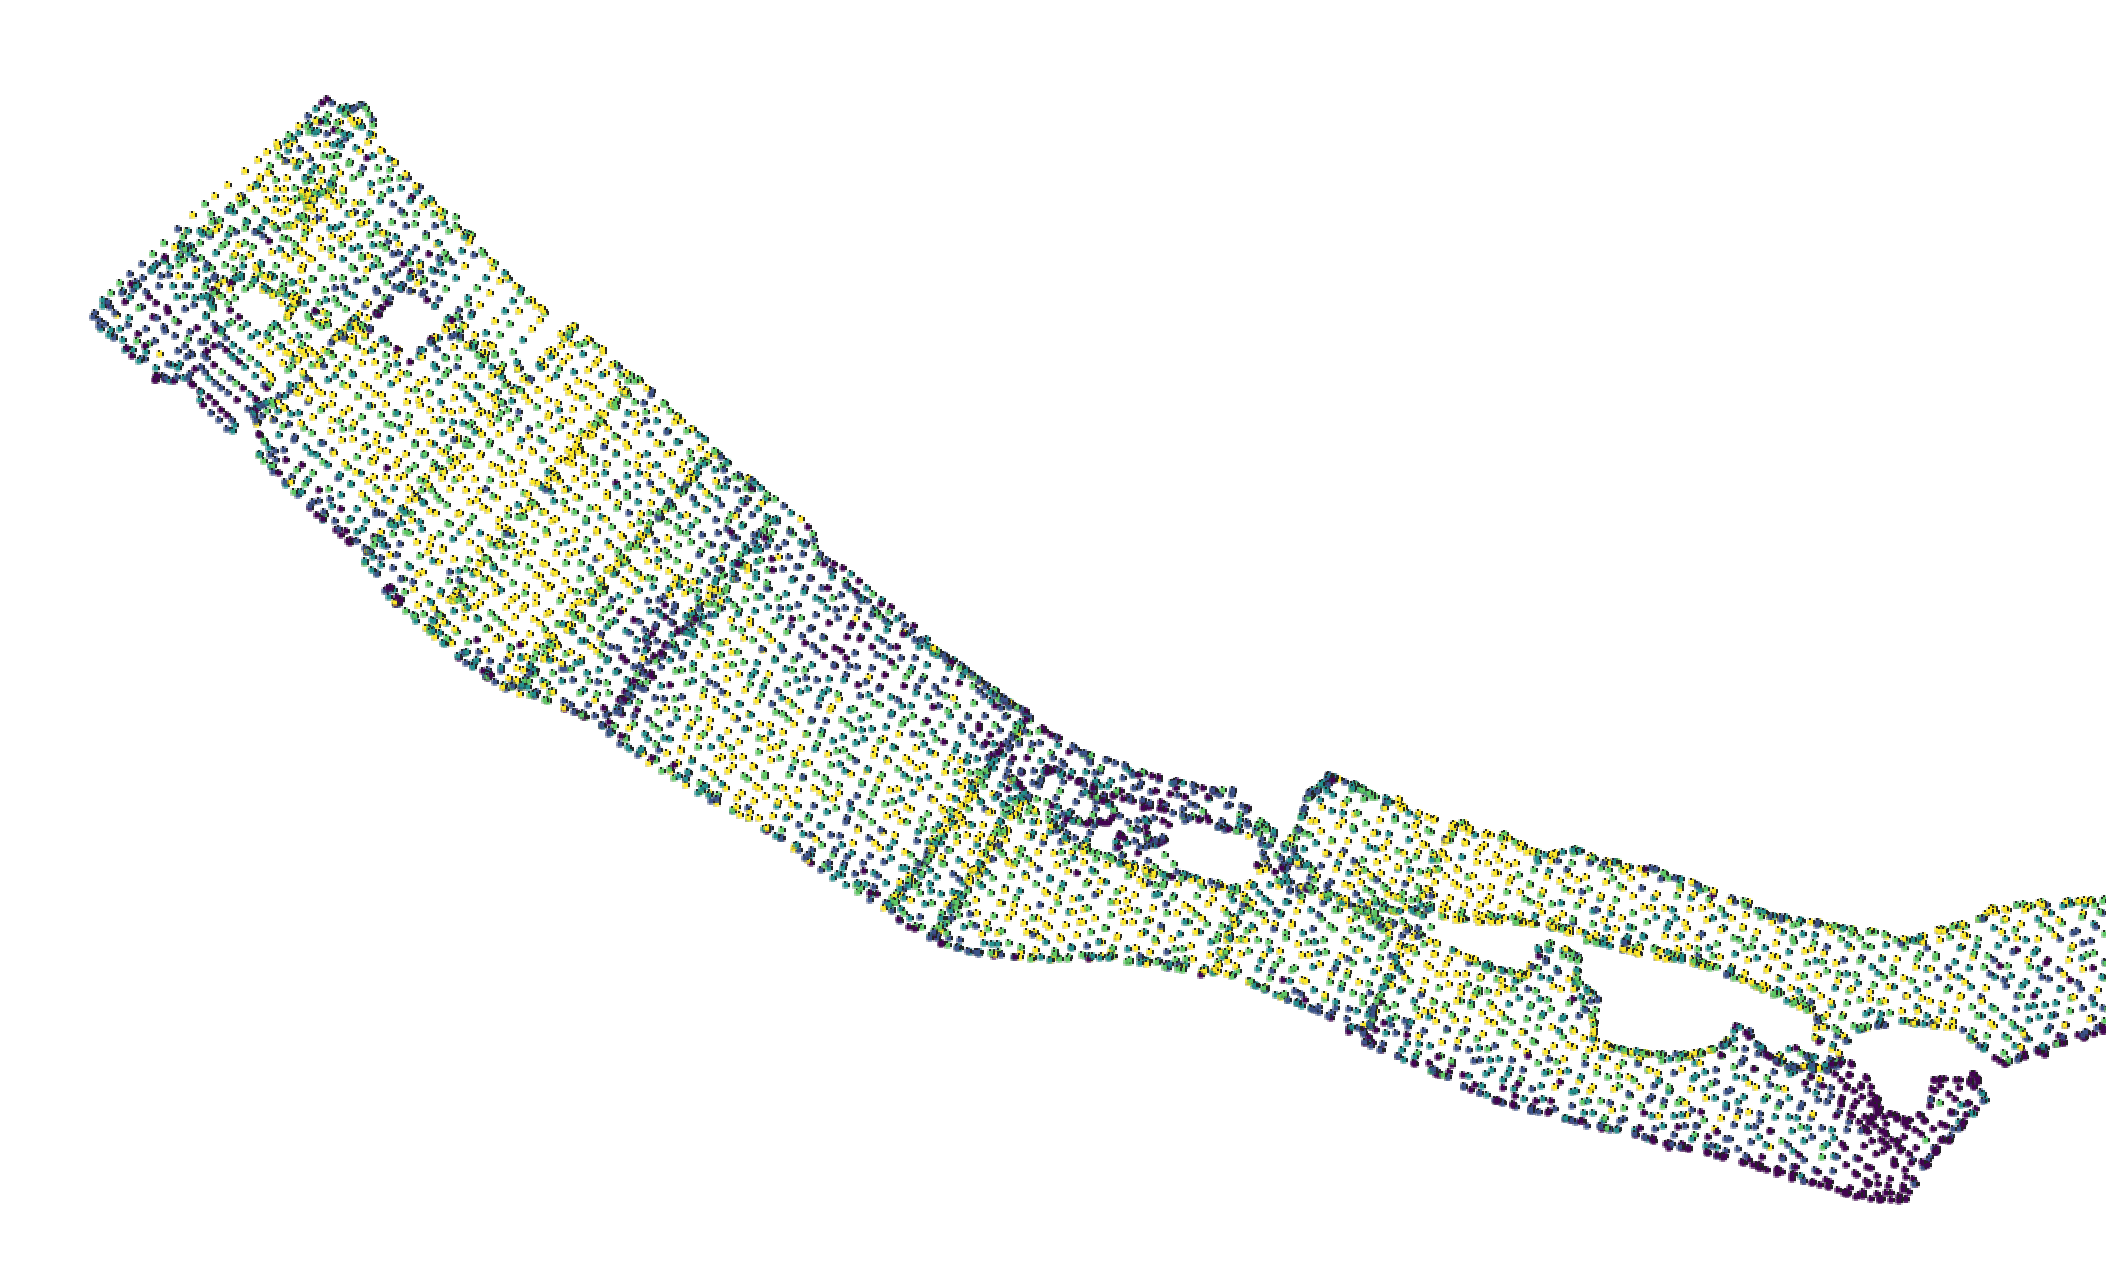
Typical survey
Below you find the settings of a typical drone borne survey with an MS-1000 and the resulting point map. The area has a length of about 1.5 km.
Sensor | MS-1000 |
Line spacing | 10 x10 m grid |
Elevation | 7 m above ground |
Speed of survey | 2.8 m /s |
Sampling frequency | 3 Hz |
Point resolution | ± 8.4 m |
Production | ±10 ha/day |
{}
Interested in more?
More details on the effects of elevation, footprint and calibration can be found in the paper "Footprint and height corrections for UAV-borne gamma-ray spectrometry studies" which can be downloaded for free from sciencedirect.