

Peak-shift from a sloped background
A Gaussian peak sitting on a linear background does not keep its centroid as its
apparent maximum. If the background has a negative slope, the observed
maximum shifts toward lower x — away from the true peak position.
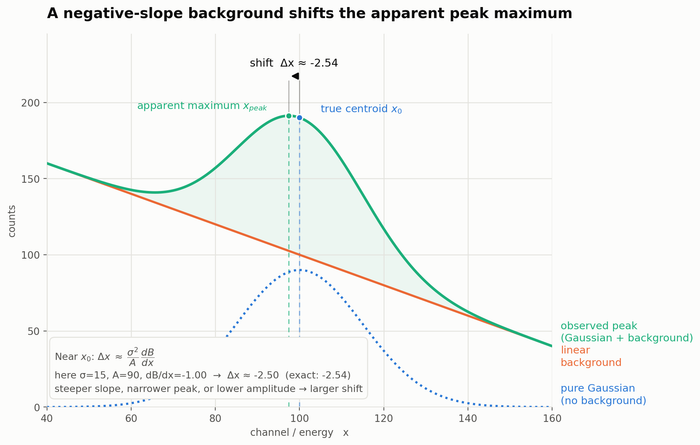
The dotted blue curve is the pure Gaussian, the orange line is the linear
background with negative slope, and the solid green curve is their sum — the
spectrum you would actually observe. Because the background is higher on the
low-x side, it pulls the summed curve's maximum away from the true centroid
x₀ toward lower x (the shift is exaggerated here for clarity: about 2.5
units for a peak width σ = 15).
Why it happens
At the true centroid, the Gaussian's own slope is zero, so the total slope of
the sum there is just the background's slope — not zero. The real maximum of
the sum must therefore sit slightly to the side where the Gaussian's rising
slope exactly cancels the background's slope.
Near the centroid this gives a simple approximation:
where σ is the peak width, A is the net peak amplitude above background, and
dB/dx is the background's slope. In the example above: σ = 15, A = 90,
dB/dx = −1.00, giving Δx ≈ −2.50 (the exact value from the curve is −2.54).
The shift grows with:
- a steeper background slope,
- a narrower peak (smaller σ has less effect — actually the shift scales with
σ², so a broader peak shifts more for the same slope and amplitude), - a weaker/lower-amplitude peak relative to the background.
It shrinks for a taller, narrower peak sitting on a nearly flat background.
Relevance to gamma-ray spectrometry
This is the same effect behind background-subtraction and centroid-correction
steps applied when fitting a photopeak sitting on a Compton continuum: a
sloped continuum under a peak biases the naive "maximum bin" or unweighted
centroid estimate, and the correction above (or a proper background-inclusive
fit) is what removes that bias.